Market intelligence / November 2026 / Investigation 014
Bromley’s house prices are falling less than London’s. But a forensic look at completed sales and more than 2,000 available homes reveals a different story for local sellers.
- −0.5% Bromley annual HPI change, August 2026
- −2.2% London annual HPI change, August 2026
- 50% of available BR1 to BR7 homes advertised for more than 90 days
If you own a property in Bromley, the latest government house price figures might come as something of a relief. The borough is apparently performing considerably better than London overall. But the headline doesn’t tell you how easy it is to actually sell.
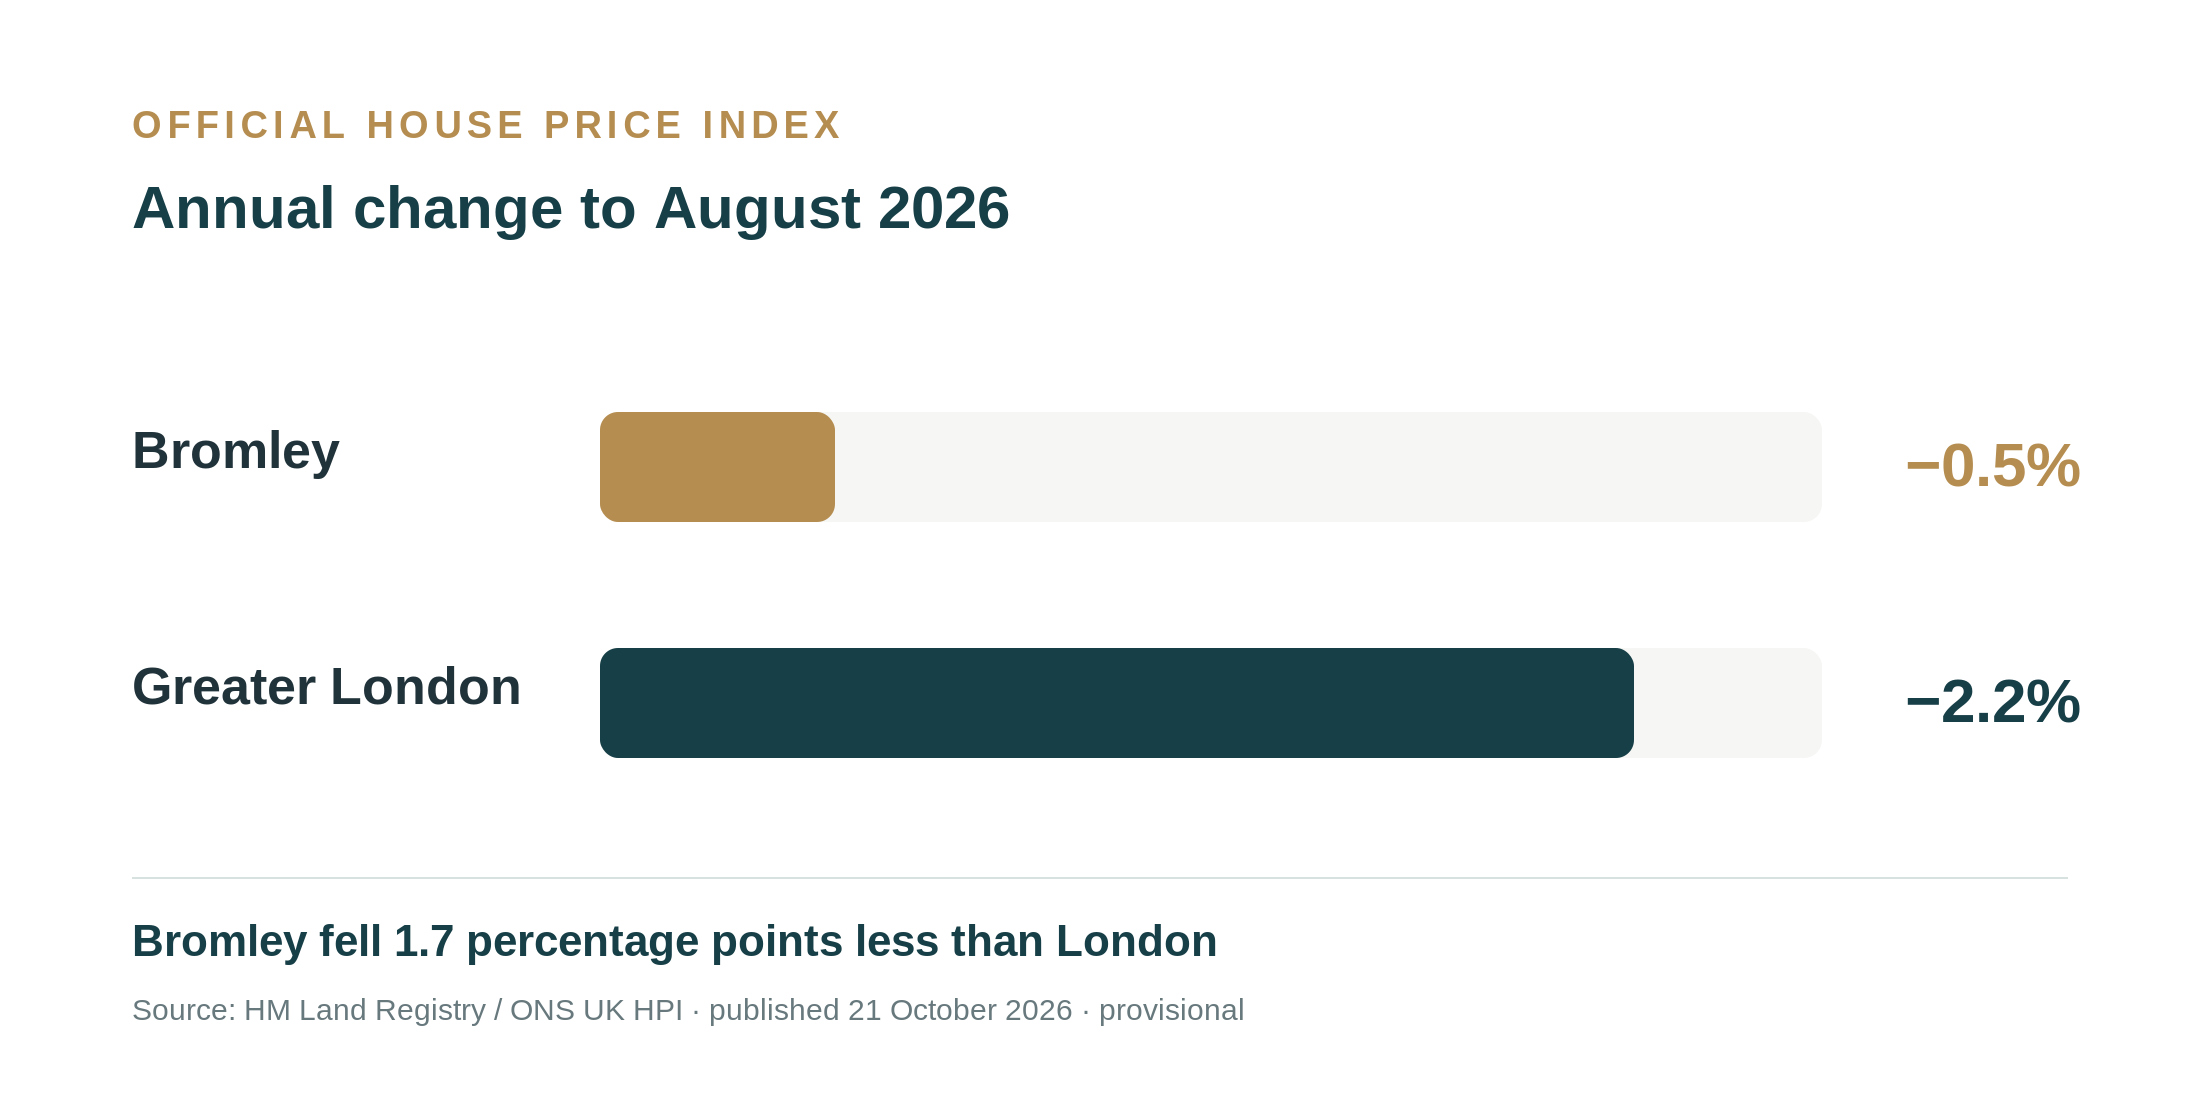
According to HM Land Registry, average prices in Bromley fell by just 0.5% in the year to August 2026, compared with a 2.2% decline across London. That’s a difference of 1.7 percentage points.
Of course, give me a statistic like that and I can’t help wondering what’s hiding behind it.
So I examined almost 4,000 completed sales across the London Borough of Bromley, compared them with approximately 75,000 across London, and investigated 2,178 properties still being advertised across the BR1 to BR7 postcode districts.
What I found was a property market with two very different stories.
The official numbers are real. But they’re only half the story.
Government figures put Bromley’s average property value at £520,253 in August 2026, down from £522,902 a year earlier. London’s average stood at £554,430, down from approximately £567,000.
I wanted to see whether actual completed transactions supported the same picture. In the 12 months to August 2026, Bromley’s median completed price fell from £510,000 to £505,000, or 1%. London’s median fell from £510,000 to £500,000, or 2%.
Over five years, Bromley’s raw completed-sale median increased by about 5.2%, compared with 1% across London.
These medians are not the official mix-adjusted House Price Index. However, they do suggest that Bromley’s relative resilience is more than a single-month anomaly.
The question isn’t whether Bromley has fallen less than London. It has. The question is why, and what that means for your individual home.
It’s a very different story for flats and houses.
Flats accounted for approximately 32% of completed sales in Bromley in the latest 12-month period, compared with roughly 49% across London.
And flats are precisely the type of property experiencing the sharpest falls across the capital.
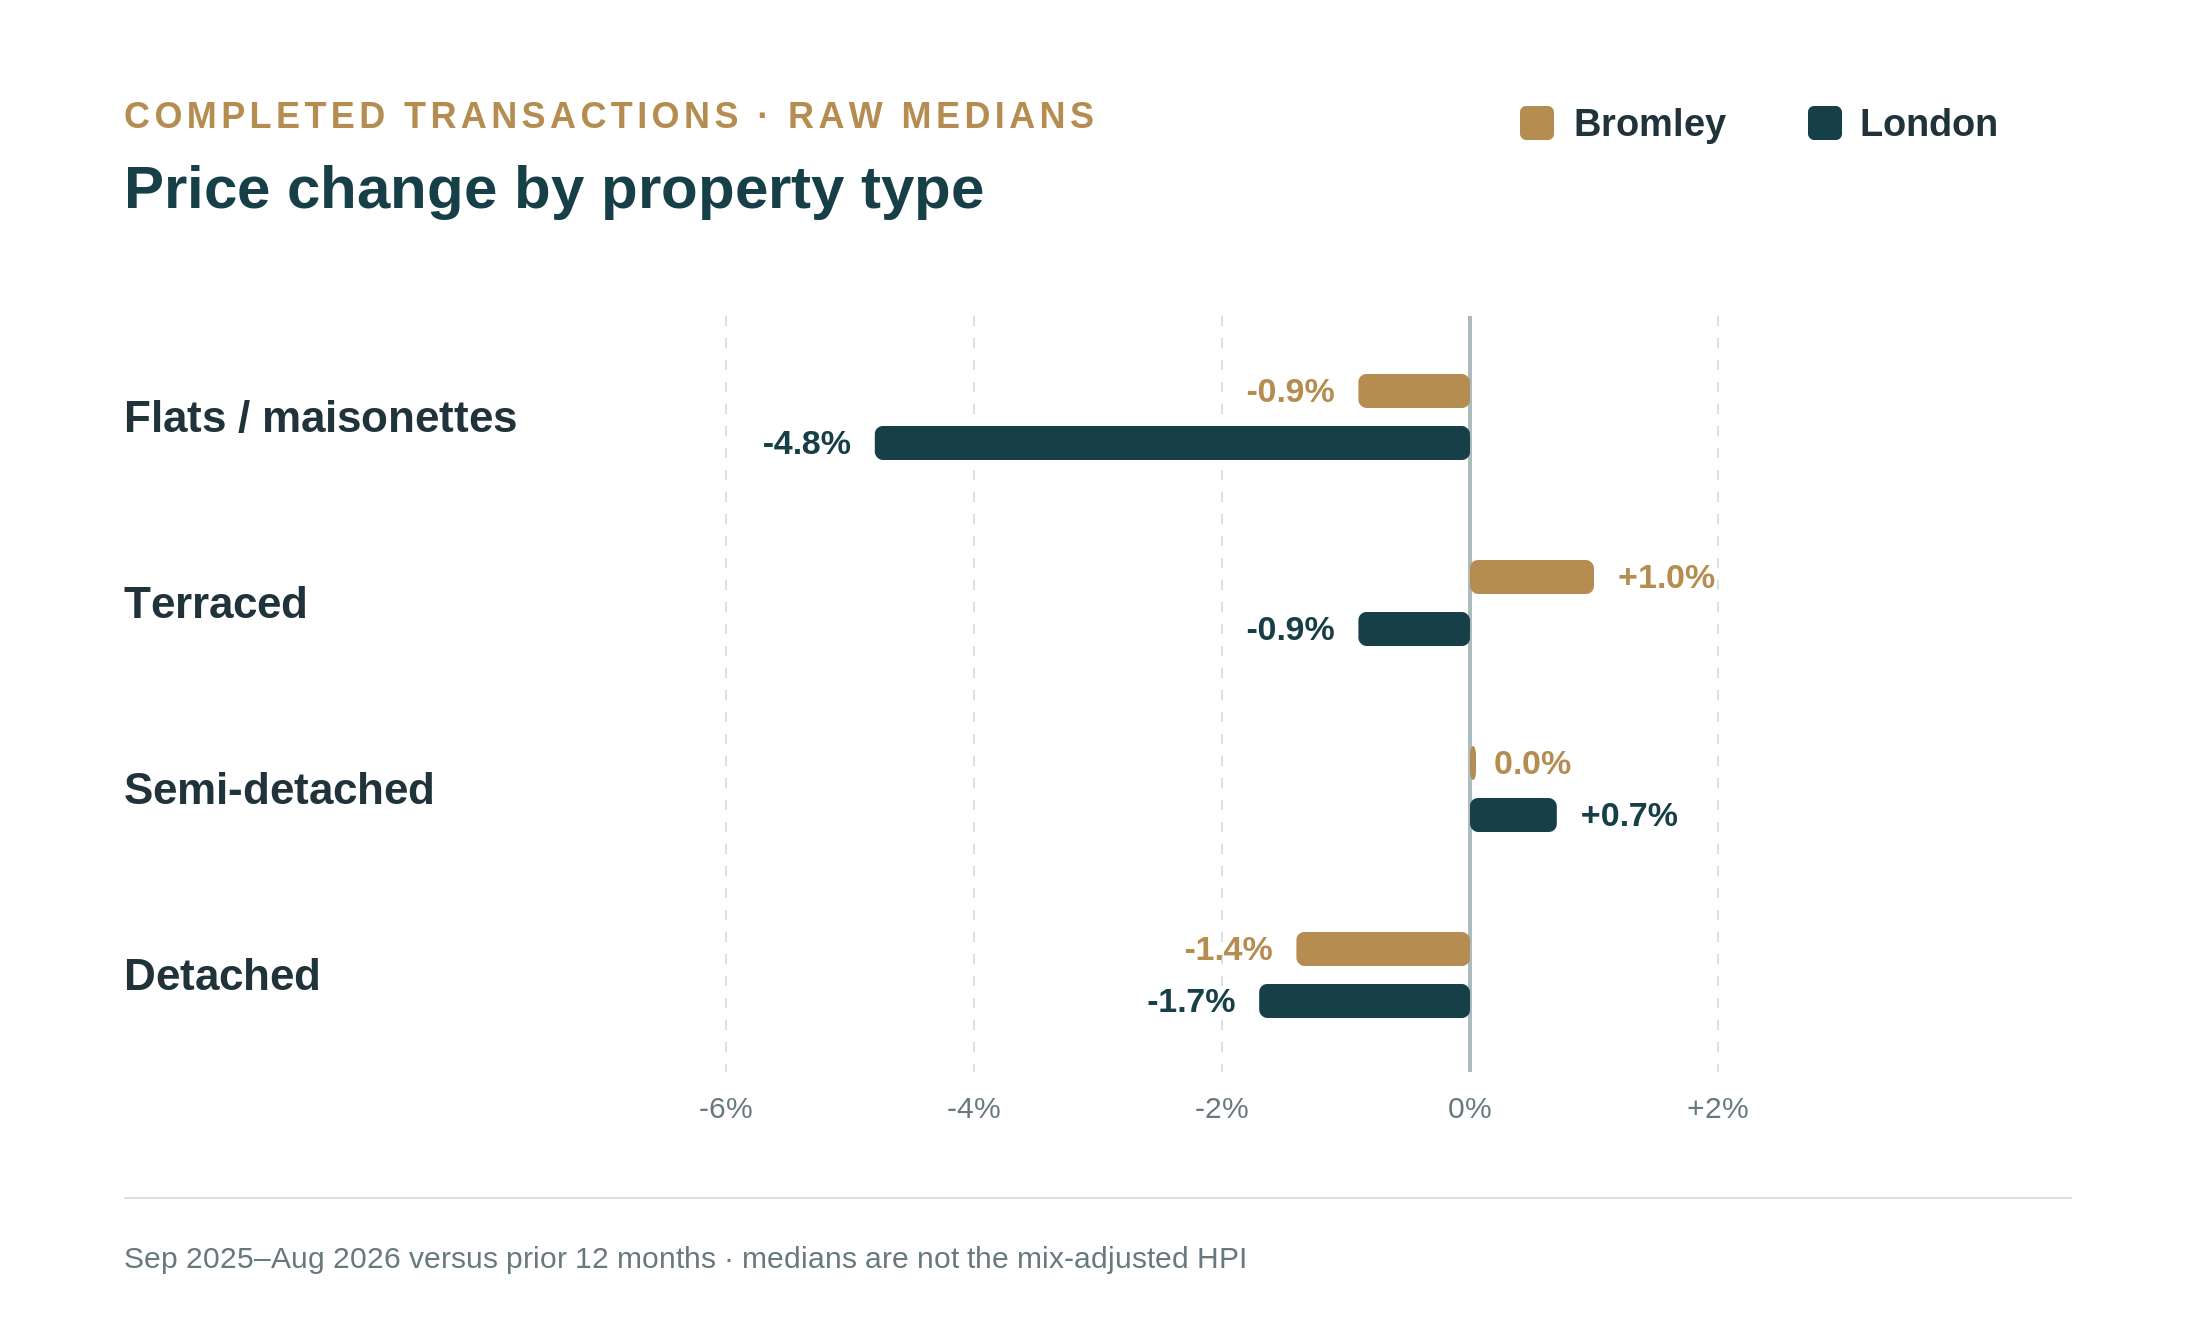
The median completed flat price in Bromley fell 0.9%. Across London, the equivalent fall was 4.8%. Bromley semi-detached prices were flat, while London semis edged up 0.7%. Terraced homes in Bromley rose 1% on this measure.
That gives us two clues. Bromley has proportionately fewer flats, and its flats are proving more resilient on completed-sale medians than London’s flats generally.
These factors are consistent with the borough’s stronger overall performance, although this analysis does not isolate exactly how much of the difference each factor explains.
And Bromley isn’t the only outer London borough with comparatively resilient prices. The official figures show Bexley rose 1.9% in the same 12-month period.
One borough. Seven very different postcode stories.
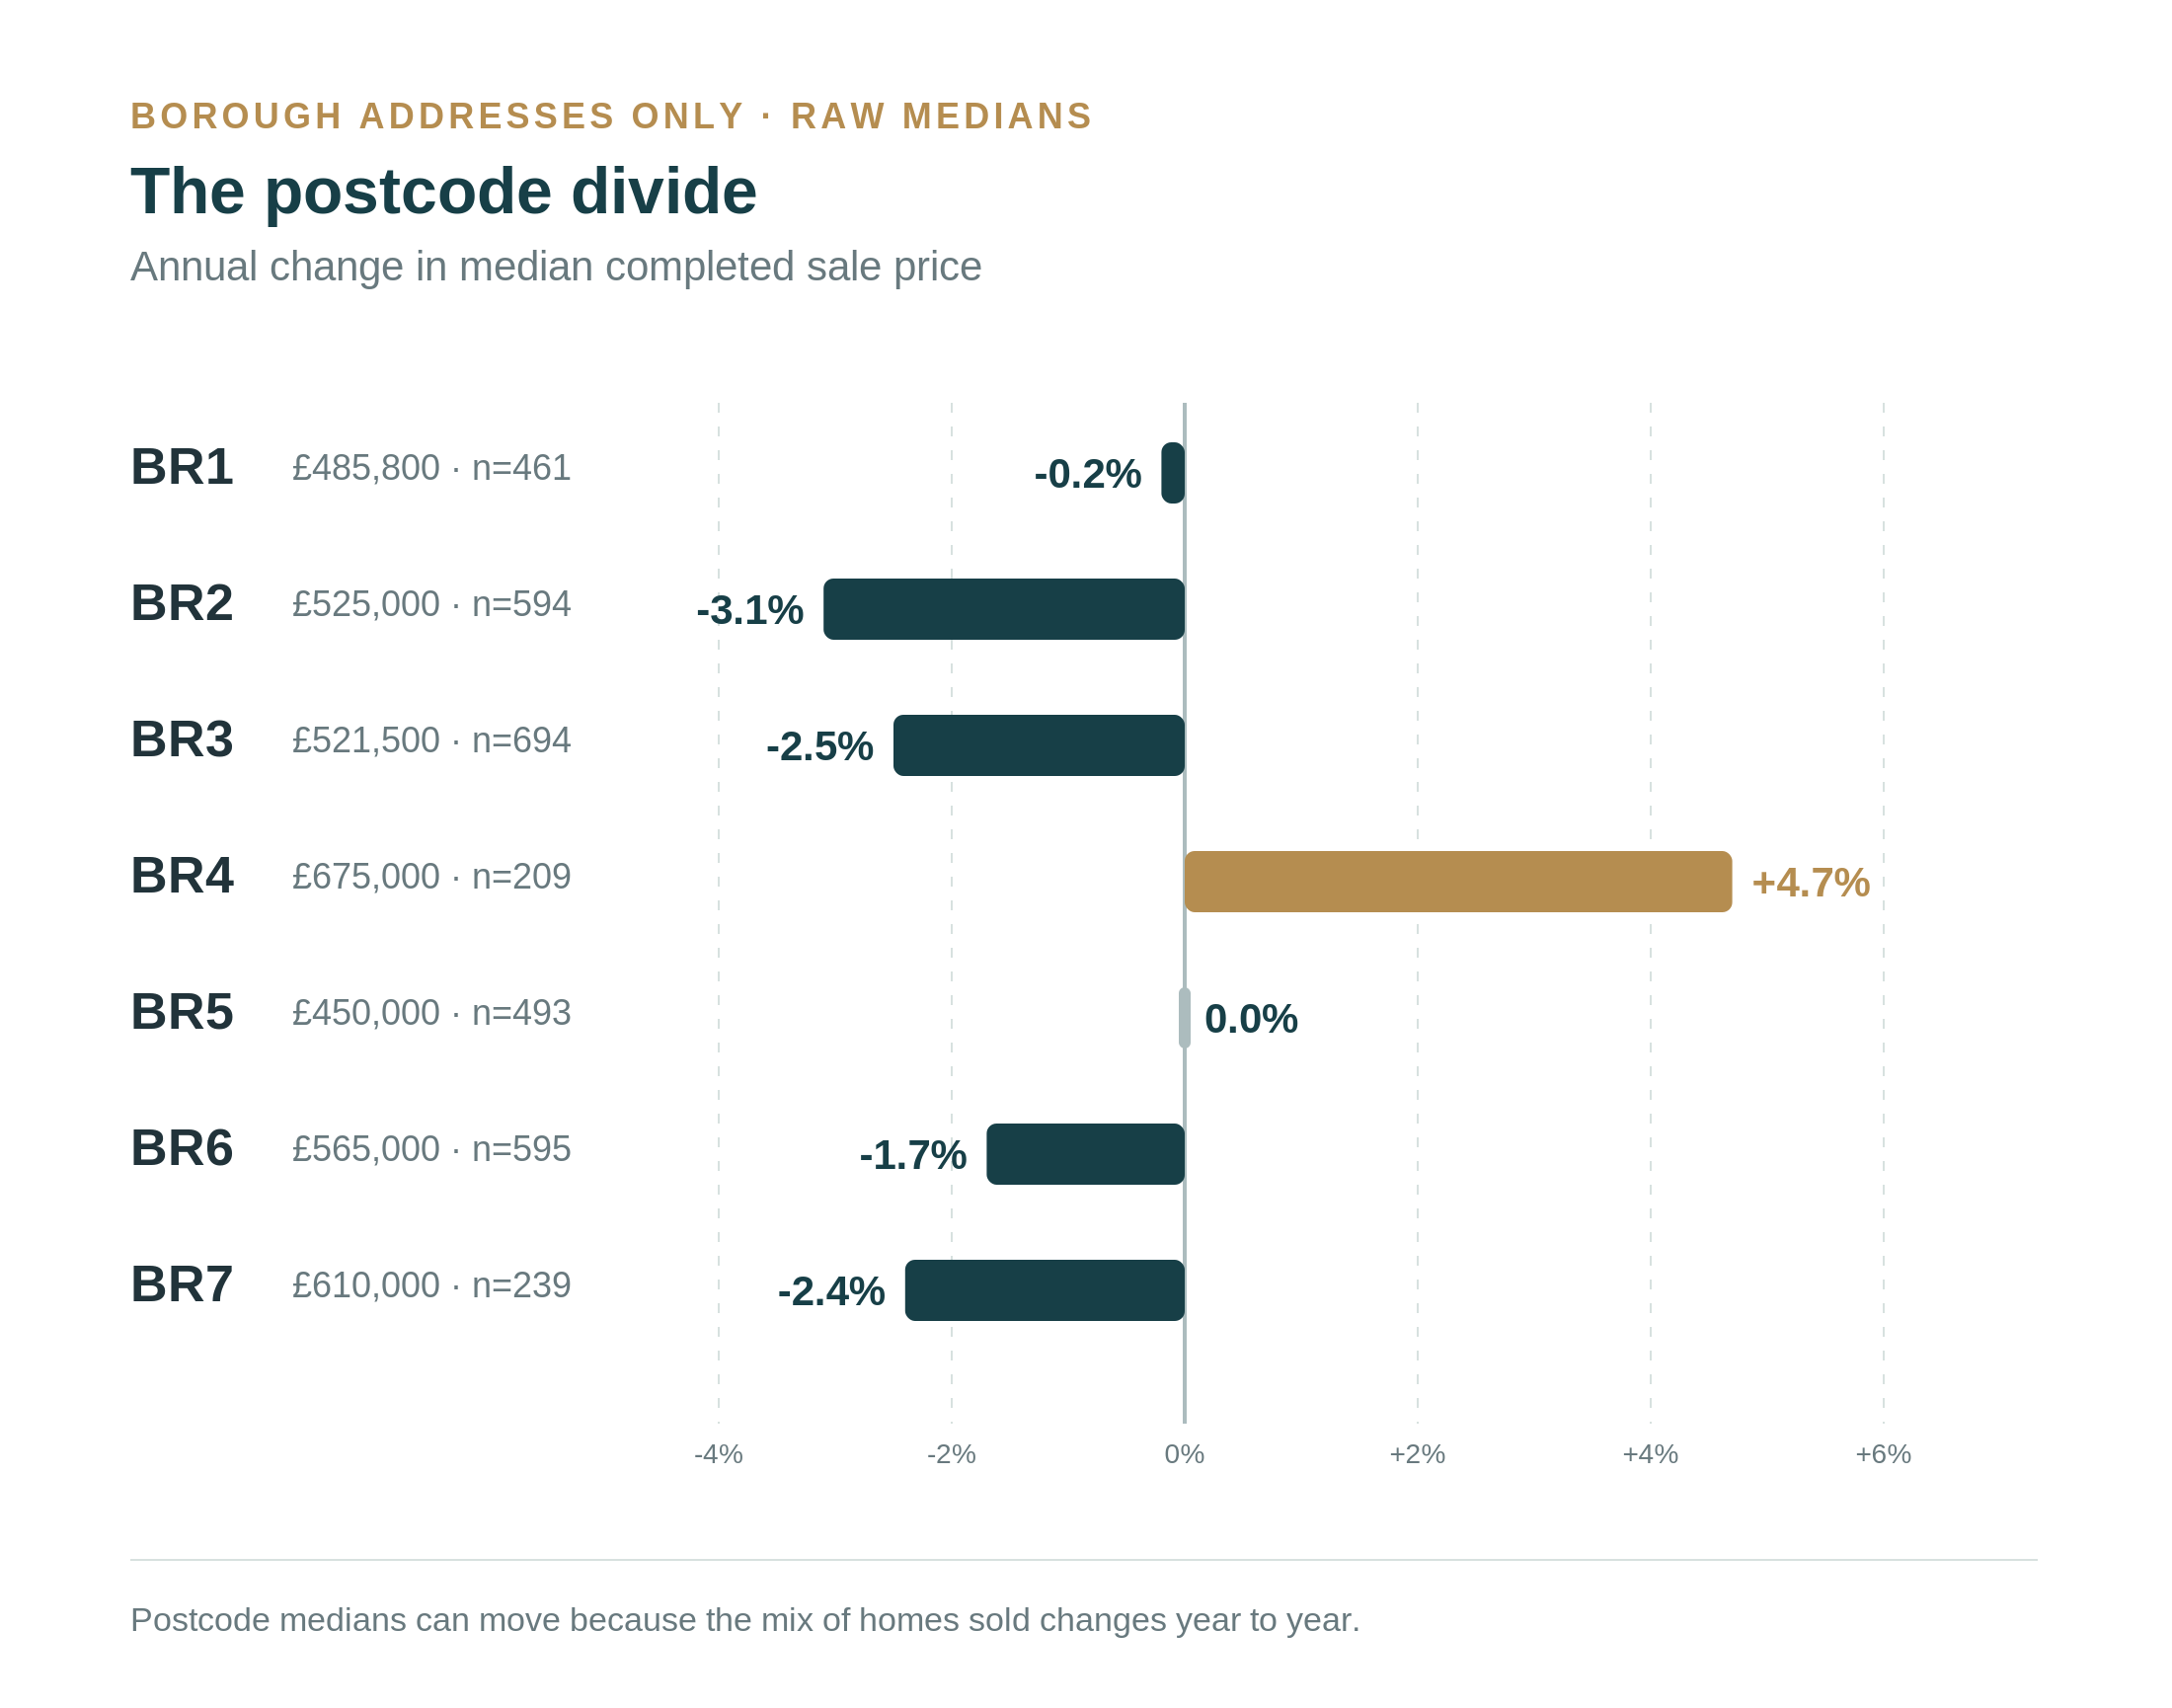
Even within Bromley, the numbers vary sharply. I compared completed transactions by postcode district, limiting the sample to addresses inside the London Borough of Bromley.
| Postcode | Median sale price | Annual change | Transactions |
|---|---|---|---|
| BR1 · Bromley | £485,800 | −0.2% | 461 |
| BR2 · Bromley South / Bickley | £525,000 | −3.1% | 594 |
| BR3 · Beckenham | £521,500 | −2.5% | 694 |
| BR4 · West Wickham | £675,000 | +4.7% | 209 |
| BR5 · Orpington | £450,000 | 0.0% | 493 |
| BR6 · Orpington / Petts Wood | £565,000 | −1.7% | 595 |
| BR7 · Chislehurst | £610,000 | −2.4% | 239 |
West Wickham’s 4.7% rise is particularly eye-catching. But its semi-detached median was broadly unchanged. That suggests the overall result is partly affected by the types of homes that happened to sell.
Beckenham’s 2.5% decline doesn’t mean that every Beckenham home lost 2.5% of its value either. These are raw sale medians, not a postcode-level repeat-sales price index.
Buyers don’t purchase borough averages. They compare individual homes with other homes they can actually buy.
Half the homes for sale have already passed 90 days.
This is where the investigation became particularly interesting for sellers.
In a live snapshot of 2,178 homes being advertised across BR1 to BR7 on 8 November, 80% had been on the market for more than 30 days and 61% for more than 60 days.
Half had been advertised for more than 90 days. A quarter had been on the market for over six months.
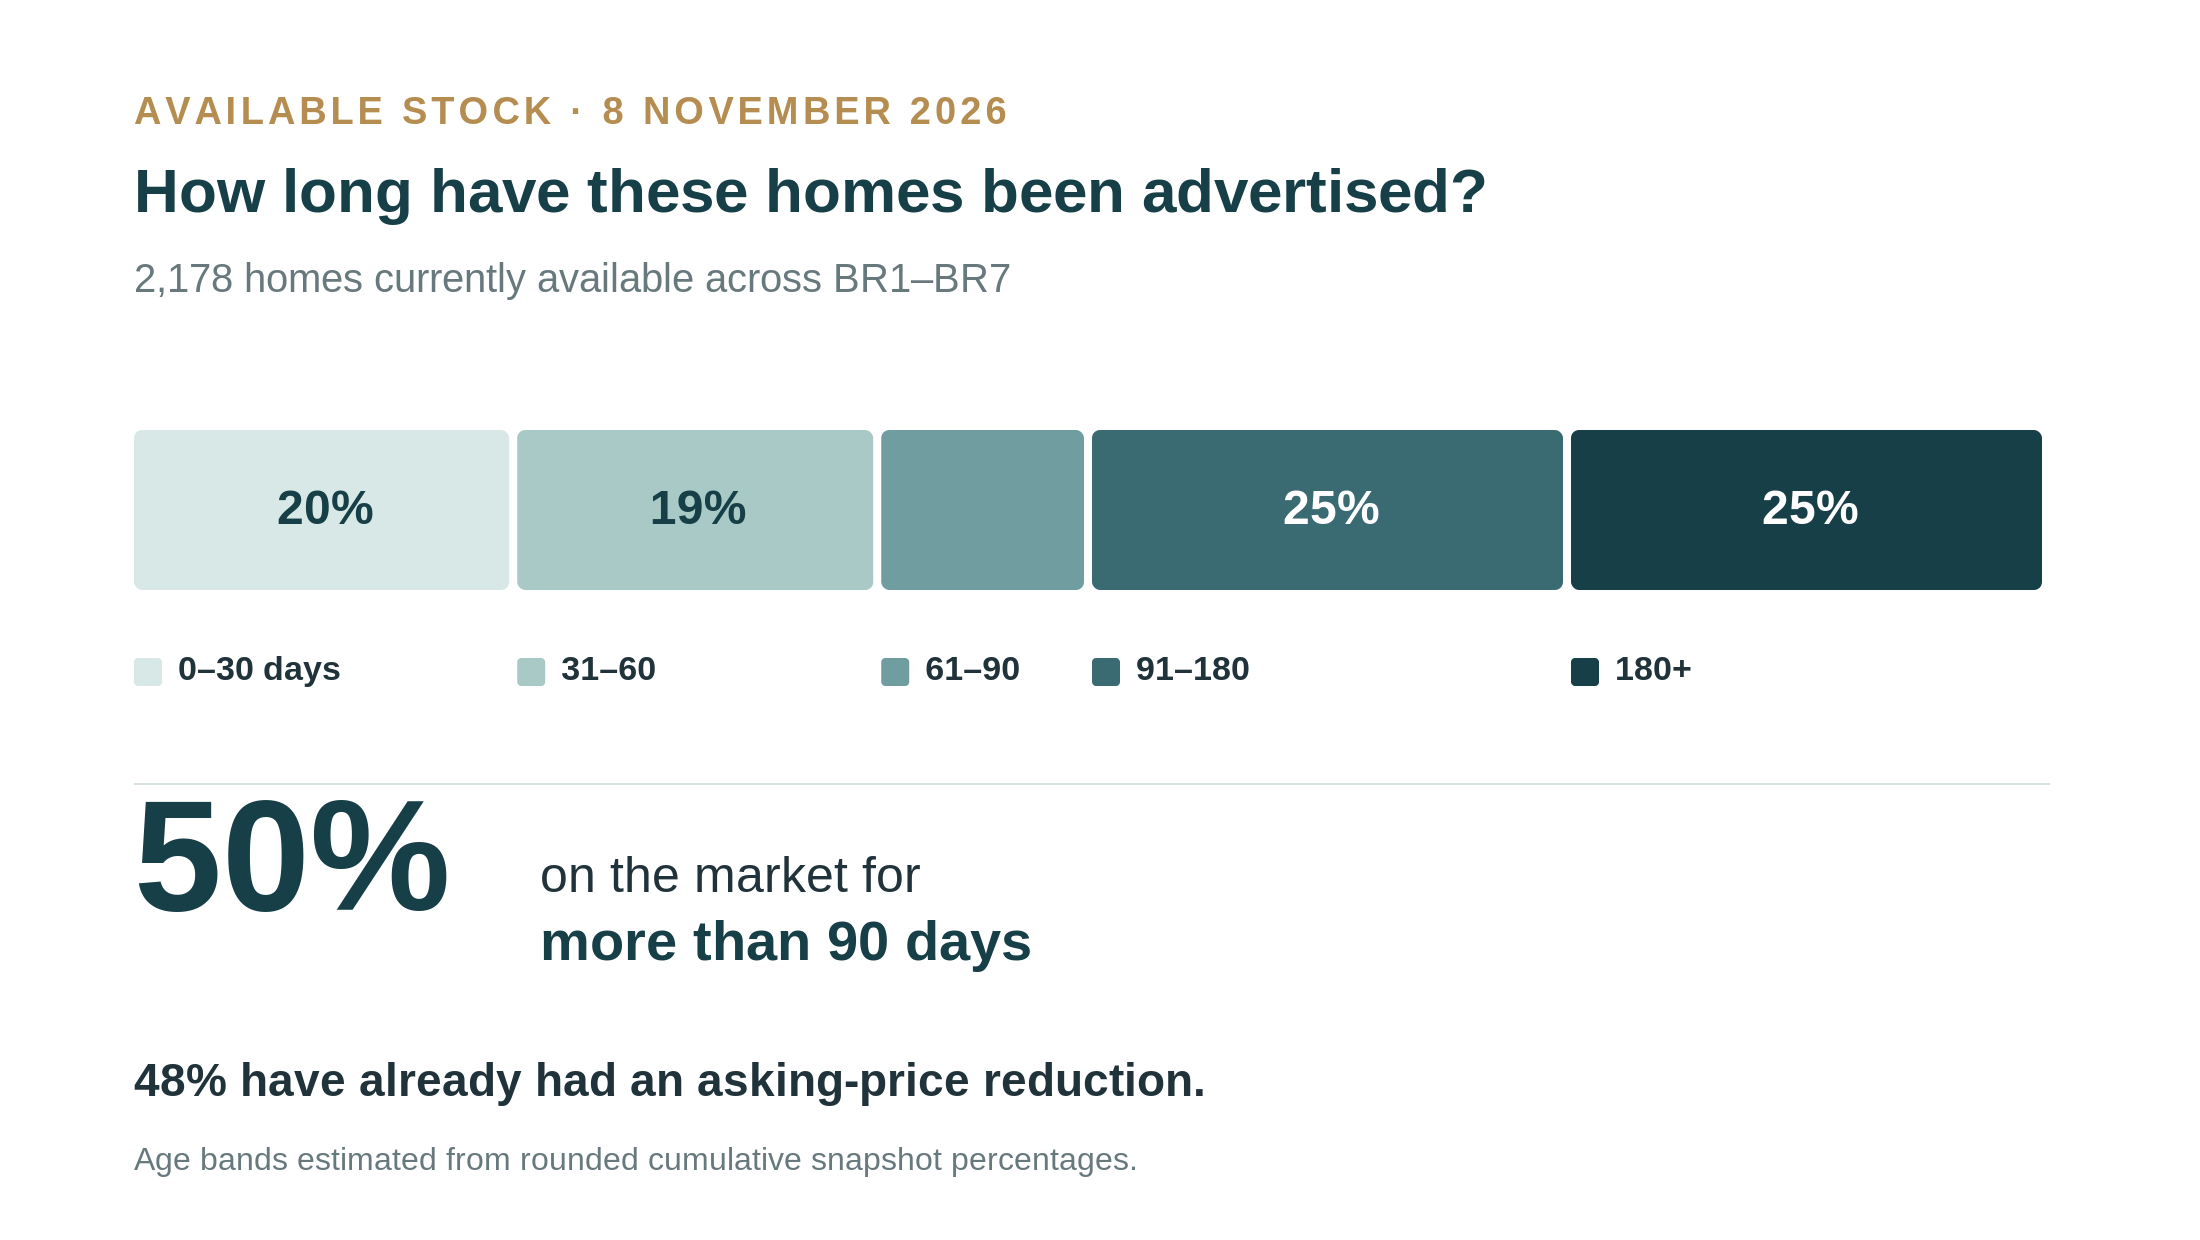
Nearly 48% of currently available properties had already undergone at least one asking-price reduction. Among reduced listings, the median cut was 6.25%.
There is an important distinction here: these percentages describe homes that are still available. Properties that sell quickly disappear from this stock, so it naturally contains a disproportionate share of longer-running listings. They are not the odds that a new listing will remain unsold for three months.
But the number of homes waiting for a buyer is substantial. Relatively stable prices and a relatively easy market are not the same thing.
Flats are over-represented among the unsold homes.
There were 782 flats in the BR1 to BR7 available-stock snapshot. They made up 36% of current availability, despite representing only 29% of October’s new listings.
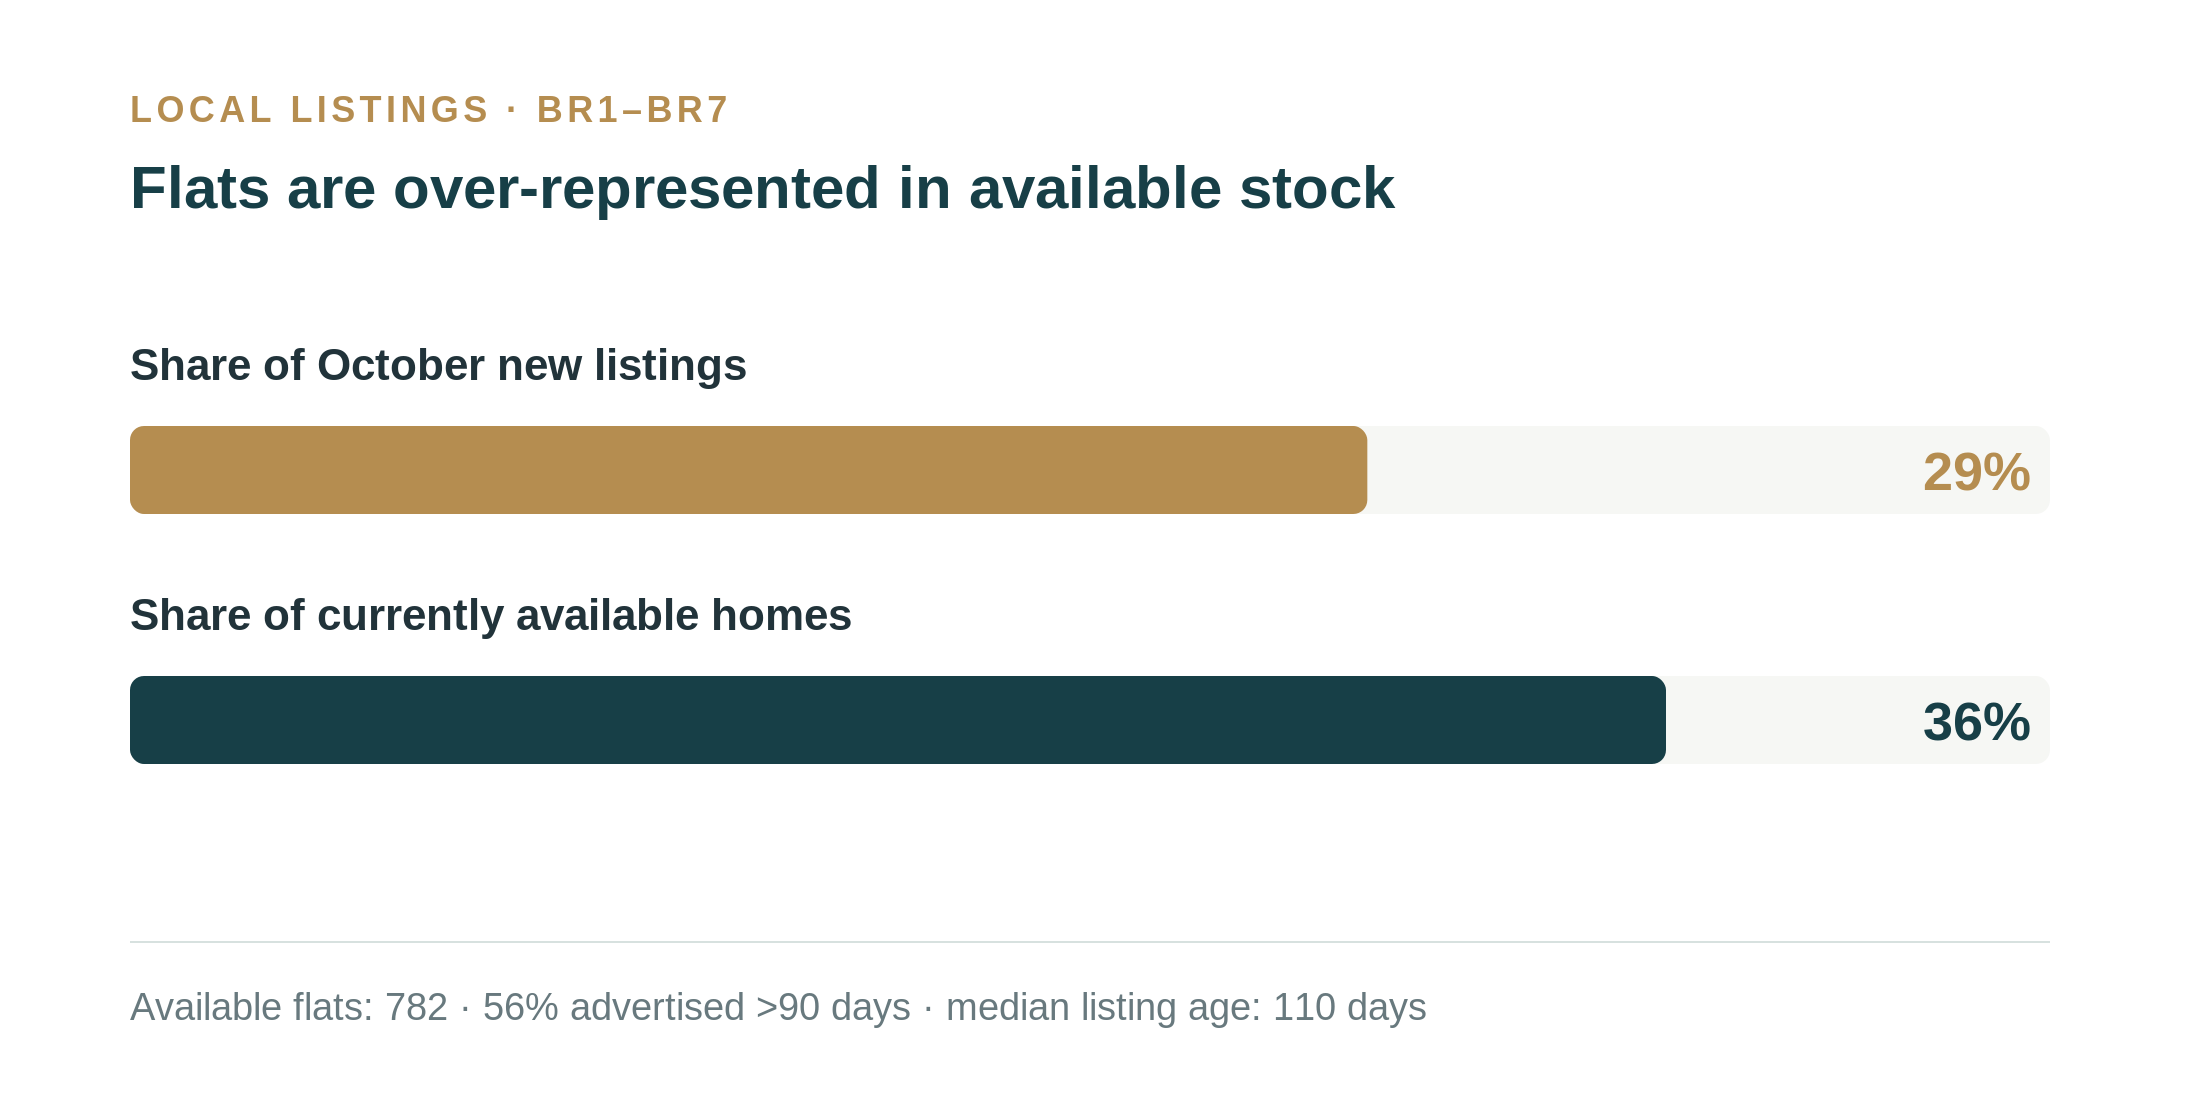
Of the available flats, 56% had been advertised for more than 90 days and 30% for over six months. The median current listing age was 110 days, compared with 62 days for available terraced homes.
Among flats with a recorded reduction, the median cut was 7.1%.
That is the paradox. Bromley flat prices have fallen less than London flat prices on completed-sale evidence, but the flats still being advertised are proving particularly difficult to shift.
Prices tell us about homes that actually changed hands. Unsold stock tells us about the properties buyers have not yet chosen.
October launches reveal a very selective market.
Across BR1 to BR7, I identified 541 properties newly listed in October. By the end of the month, 58 had reached sold subject to contract. By 8 November, that figure had risen to 89.
But the likelihood of securing an offer within October varied substantially by property type.
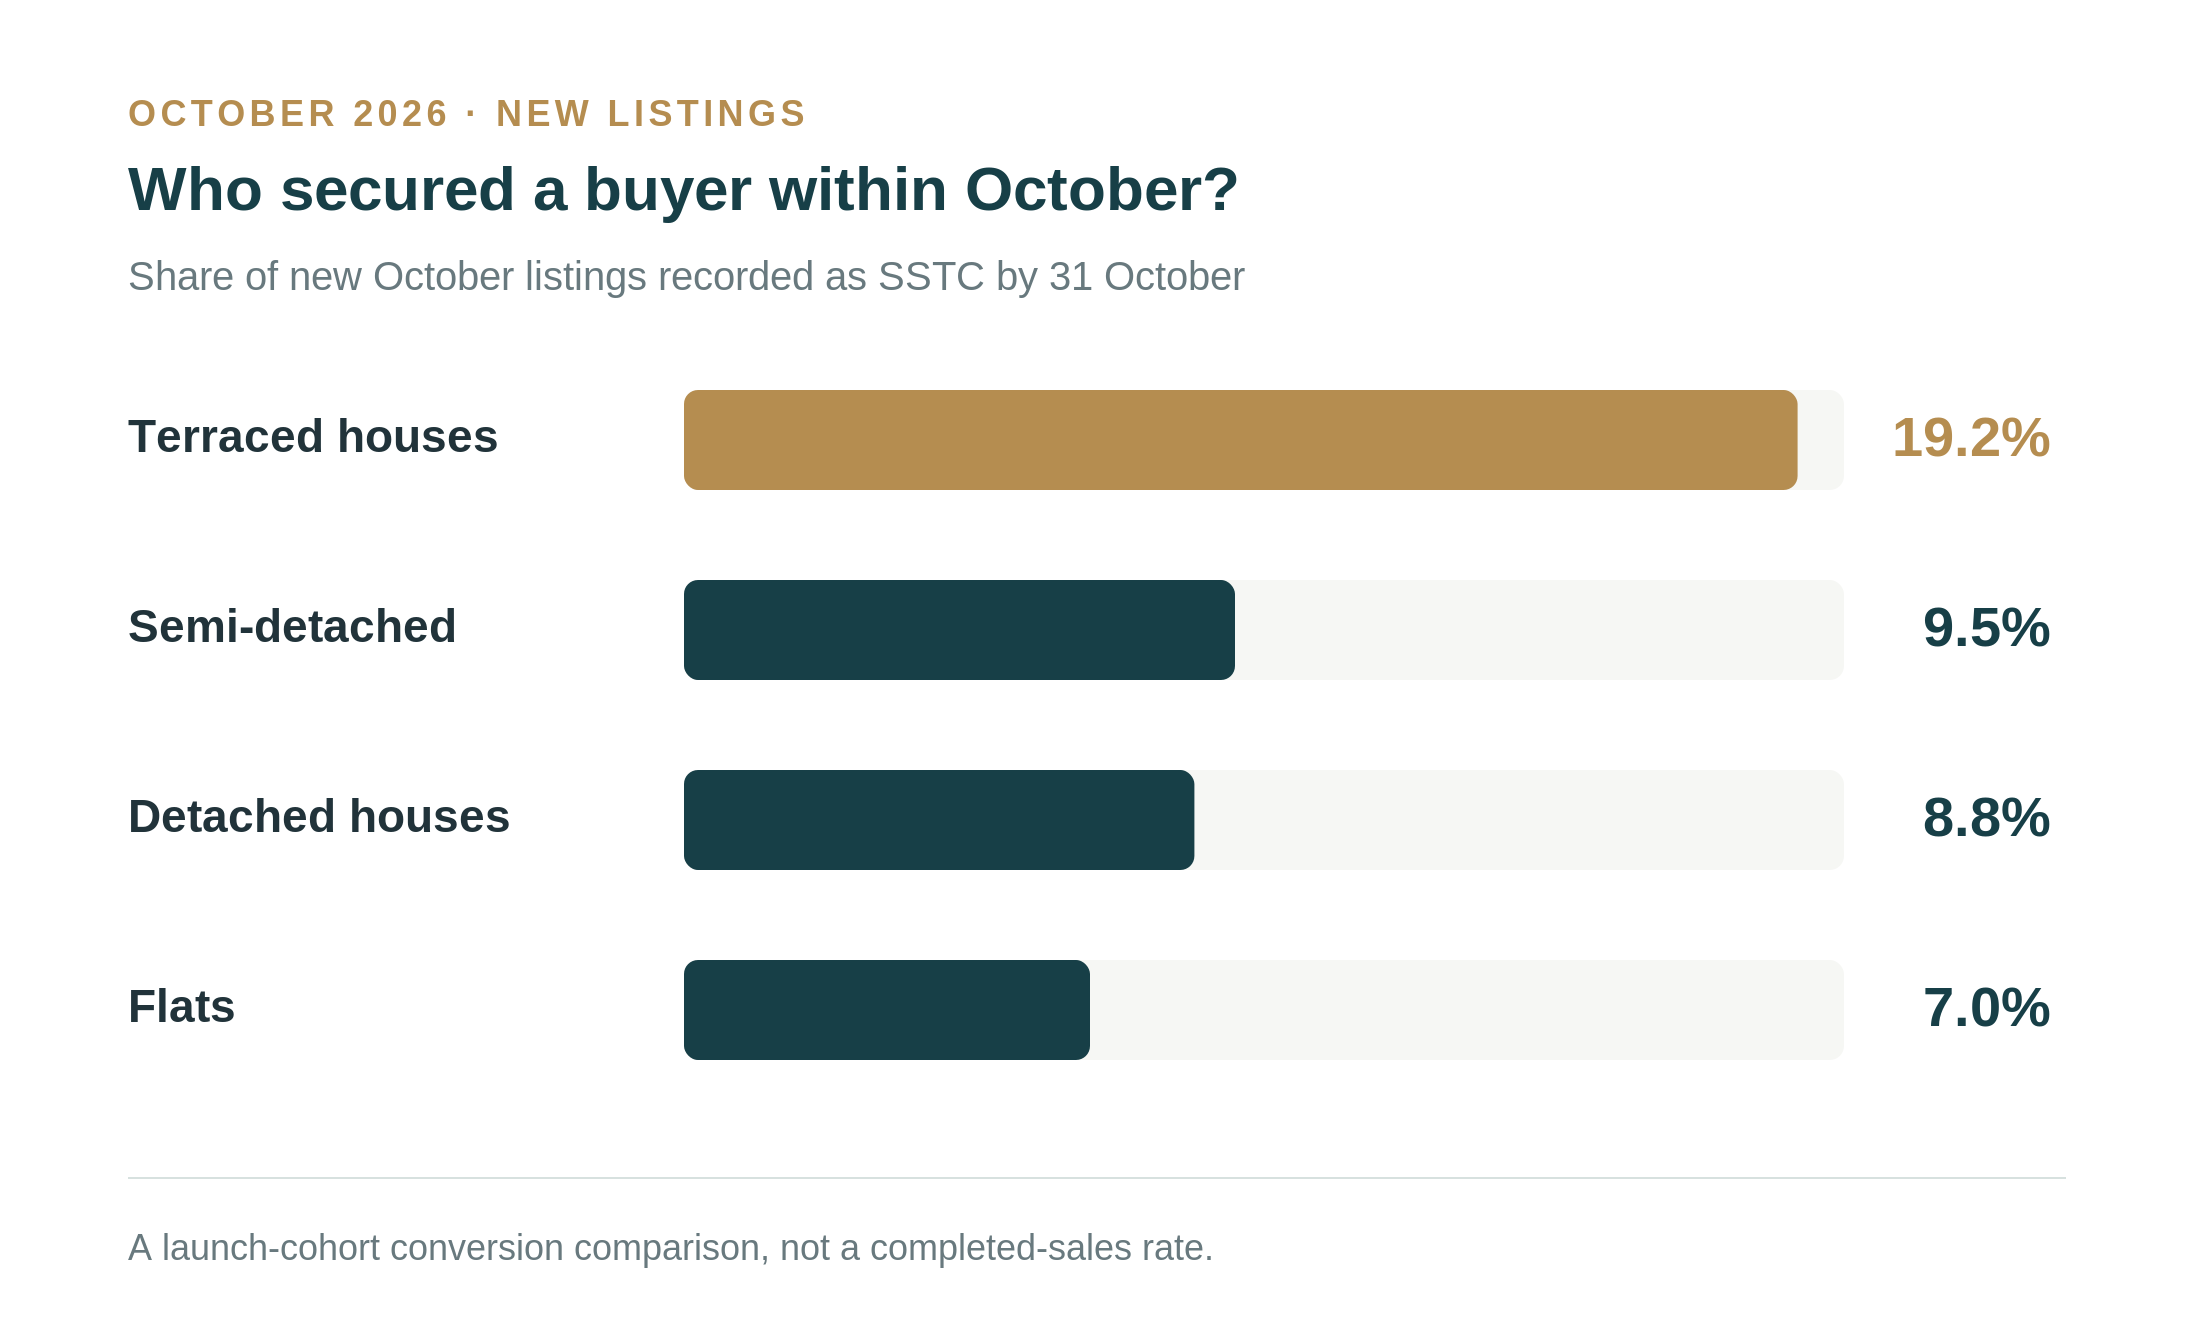
Terraced houses were the standout: 24 of 125 October launches secured a buyer within the month, or 19.2%. For flats, the equivalent figure was 11 of 158, just 7%.
In other words, a new terraced listing was around 2.7 times as likely to have reached SSTC within that same month as a newly listed flat.
Two examples show how fast things can happen. 61 Cowper Road, Bromley BR2 9RT was listed at £550,000 on 23 October and recorded as SSTC on 25 October. 15 Ridgeway Crescent, Orpington BR6 9QL was listed at £485,000 on 1 October and recorded as SSTC on 3 October.
These are advertised asking prices, not verified achieved sale prices. Nor can the records prove precisely why buyers acted. But they show that motivated purchasers are still moving quickly for some homes.
The market hasn’t stopped. Buyers are making choices, and those choices are increasingly selective.
Fewer transactions, even where prices are holding up.
Completed sales in the London Borough of Bromley fell from 4,889 to 3,965 between the two 12-month periods in the research. That’s a decline of approximately 19%.
London saw a larger recorded decline of around 25%.
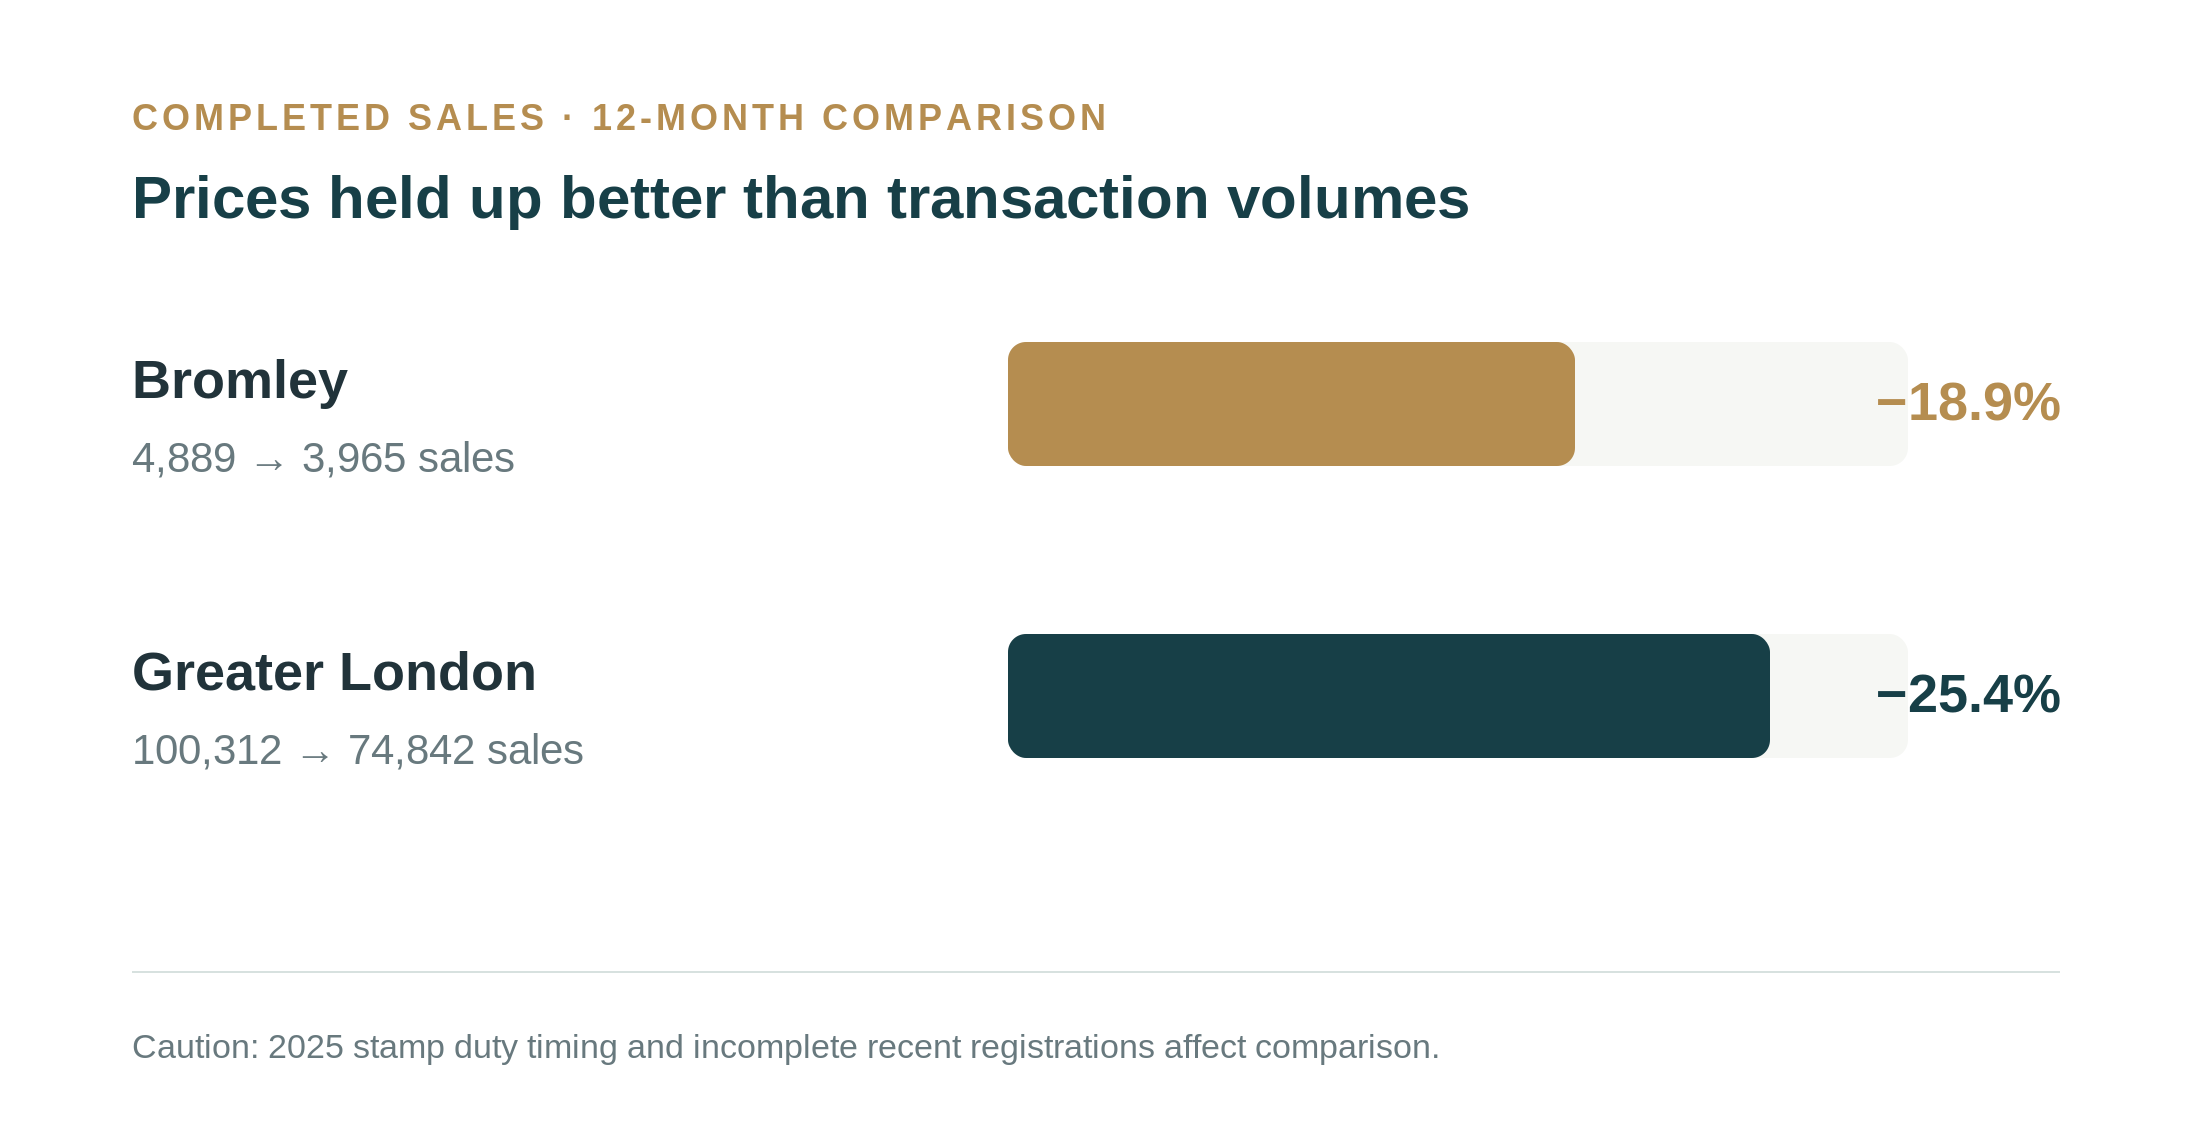
That comparison requires caution. The previous period included a rush to complete before the April 2025 stamp duty change, and some more recent transactions have yet to appear in Land Registry records.
Even so, the broader picture is clear: relative price resilience doesn’t mean the same number of people are buying.
So why are buyers choosing some homes and not others?
After over 18 years working in property, I’ve learned that a good home rarely struggles to sell for one simplistic reason.
Sometimes it is the asking price. Sometimes the presentation doesn’t convey what makes the home special. Sometimes a nearby competitor simply appears to offer better value, or the wrong buyers are being reached.
This is why I pay so much attention to what I call the Momentum Window™, the crucial early launch period when a property can attract buyers who have been waiting for something suitable.
Once a home has spent several months on the portals, another reduction won’t necessarily recreate that early attention. It may take a properly considered change of positioning, marketing or presentation.
For anyone already trying to sell, I’d start with three questions:
- What are buyers choosing instead of your property?
- What do those choices tell us about its position in the market?
- What would genuinely need to change to give buyers a reason to look again?
Those questions are considerably more useful than being told that London’s average house price has fallen.
Bromley is outperforming London. But your property is its own market.
On the latest official figures, Bromley has experienced a smaller annual price fall than London. The independent completed-sale comparisons point in the same direction.
But the research also shows that the outcome varies dramatically between property types, postcodes and individual listings. Flats form a smaller share of Bromley’s market and have been more resilient here than across London, while available flat stock is building up.
And half the homes currently advertised across BR1 to BR7 have already been on the market for more than three months.
The most important question isn’t whether Bromley is outperforming London. It’s whether your home is outperforming the properties it’s competing against.
That’s where a forensic look at the evidence becomes useful.
Is your home being overlooked?
My free Property Perfectionist™ Market Intelligence Report examines the competing homes buyers can choose, actual local market performance and what the evidence suggests about your property’s position.
Clarity before decisions. Evidence before guesswork.
James Hall
The Property Perfectionist™ · Independent Property Consultant
Powered by eXp · Over 18 years in property
07855 828 736 · james.hall@expuk.com
Research notes & methodology
Official price figures: HM Land Registry / ONS UK House Price Index for August 2026, released 21 October 2026. Official local prices and annual changes are provisional and may be revised.
Completed sale comparisons: Recorded Land Registry price-paid sales, September 2025 to August 2026 versus September 2024 to August 2025. Raw median changes are not equivalent to a mix-adjusted HPI. Recent registrations are incomplete. Postcode medians include only transactions at addresses within the London Borough of Bromley.
Live property research: Market listing records captured 8 November 2026 across the BR1 to BR7 postcode districts. These districts are not identical to the borough boundary. Listing dates, advertised prices, reductions and status records can change or be incomplete. SSTC means an offer has been accepted, not that the sale has completed. All individual property prices described in the October examples are advertised asking prices.
Interpretation: Changes in the mix of completed transactions can move raw medians. Listing-age statistics describe remaining available stock, not the probability that every newly launched property will fail to sell.
Every unsold property leaves clues. Clarity. Not optimism. Not guesswork. Just evidence.


Leave a Reply