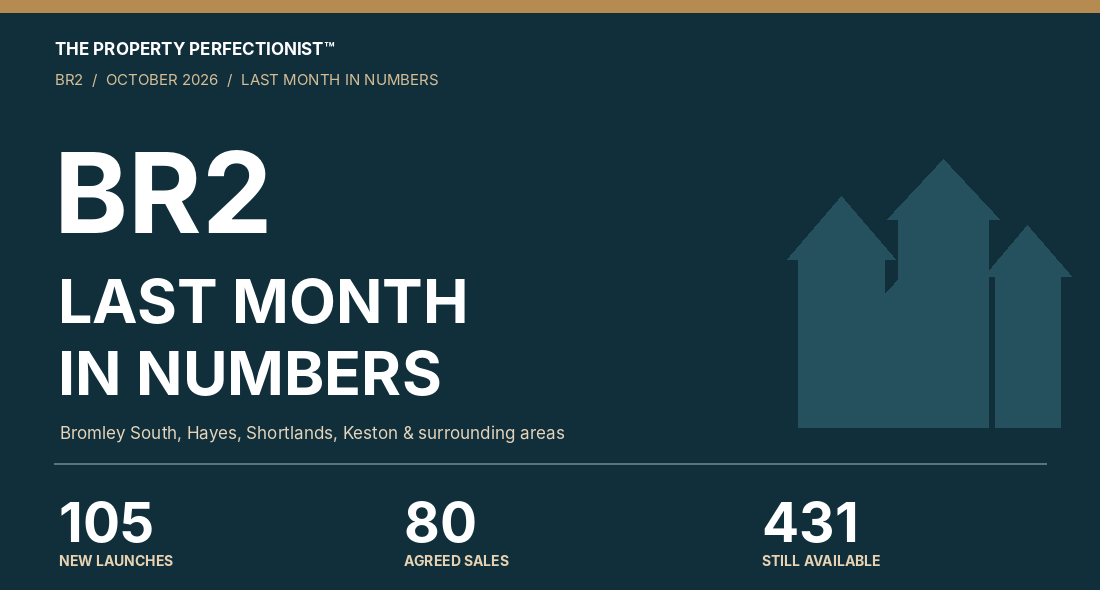
The Property Perfectionist™ | October 2026 | Data snapshot: 5 November 2026
A hundred properties withdrawn. Eighty sales agreed. And more than half of the homes still for sale had already been advertised for over 90 days.
That was the story in BR2 during October. But it would be a mistake to conclude that buyers simply aren’t buying. Some homes found buyers in two days. Others have been on the market for months, even after substantial asking price reductions.
I wanted to understand the difference. So I examined the figures for Bromley South, Hayes, Shortlands, Keston and the wider BR2 postcode district.
What actually happened in October?
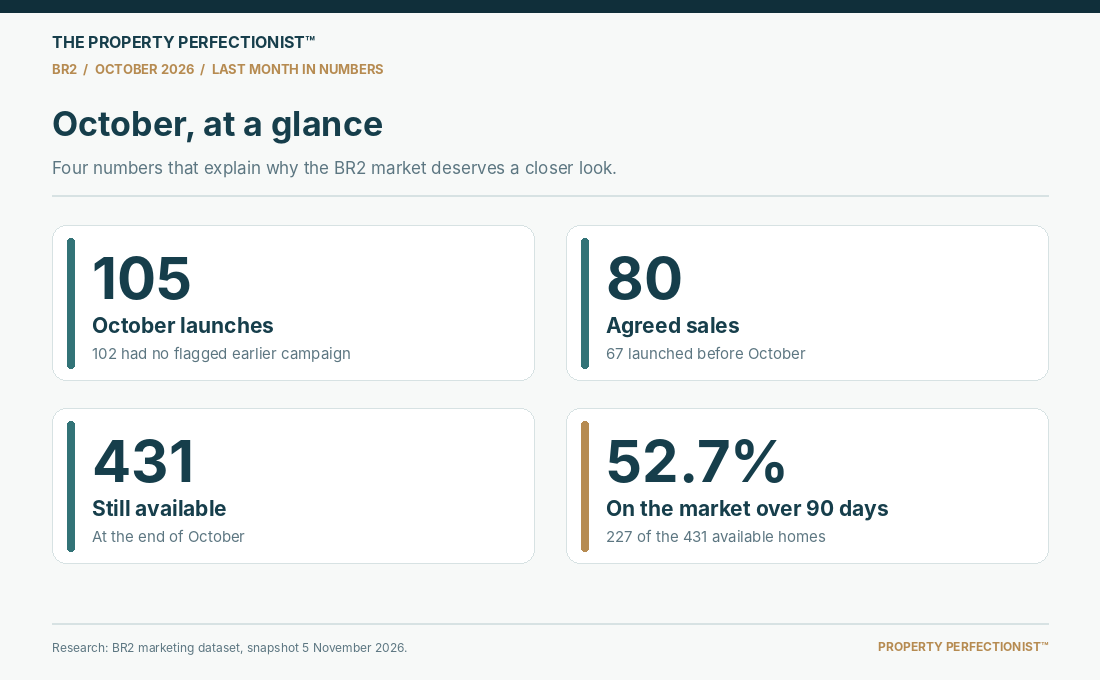
There were 105 new marketing campaigns, while 80 properties went under offer or were marked sold subject to contract. These are different groups. Of the 80 agreed sales, 67 involved homes originally listed before October.
At the end of the month, 431 homes remained available, including 227 that had been advertised for more than 90 days. That’s 52.7% of the available market.
A further 100 withdrawals were recorded during October, compared with 80 agreed sales, and 20 previously agreed sales were recorded as having fallen through.
The estimated available stock fell from 501 to 431 homes. That sounds encouraging until you realise withdrawals outnumbered agreed sales. A shrinking number of listings isn’t necessarily evidence of growing demand.
Of the 105 October campaigns, 102 had no recorded relisting or failed sale marker. That doesn’t guarantee they were all genuinely new instructions, because earlier marketing history can be incomplete.
Four property types, four very different markets
Of the homes first advertised in October, only 13 of 105 had secured an offer by 31 October, giving an early launch success rate of 12.4%.
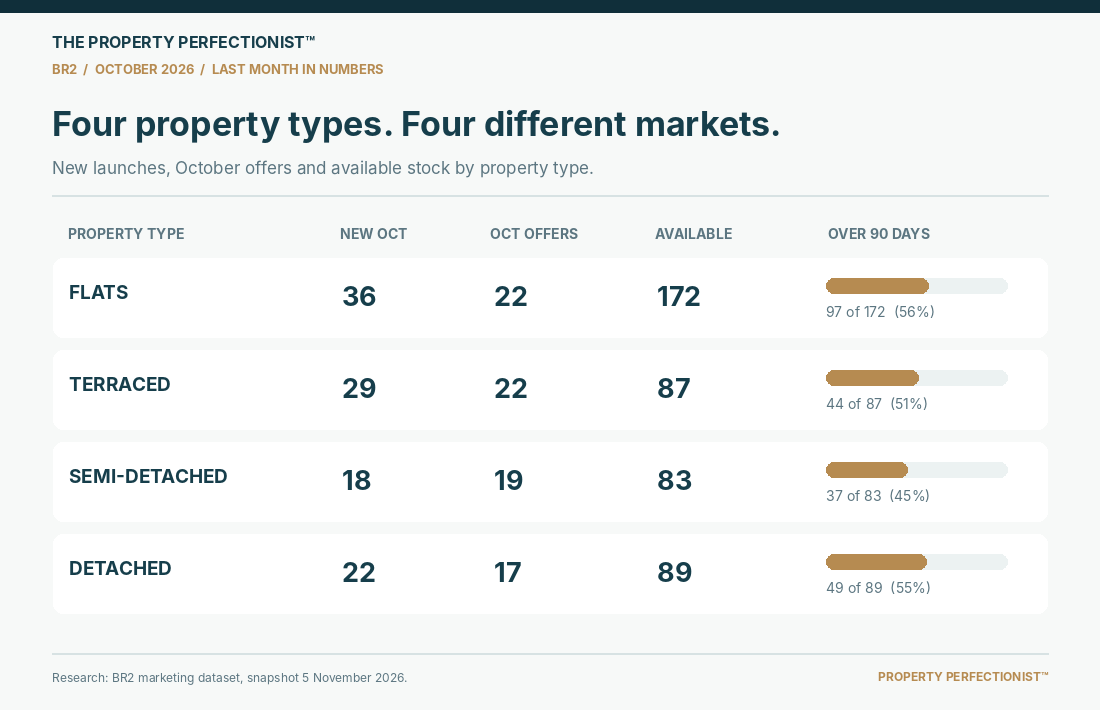
Terraced houses led the way with five of 29 launches, or 17.2%, under offer by month end. Semi detached houses followed at 16.7%, compared with 9.1% for detached houses and 8.3% for flats.
Those aren’t eventual selling probabilities. A home listed on 29 October had only two days in which to attract an offer before the measurement date. Still, the differences are useful clues.
Flats had the greatest accumulation of unsold stock: 172 remained available, including 97 marketed for over 90 days. There were also 87 terraced houses, 83 semis and 89 detached houses still available at month end.
The volume of competition facing a flat seller is very different from the choice confronting a buyer of a typical three bedroom terraced house.
Flats: the stock problem is difficult to ignore
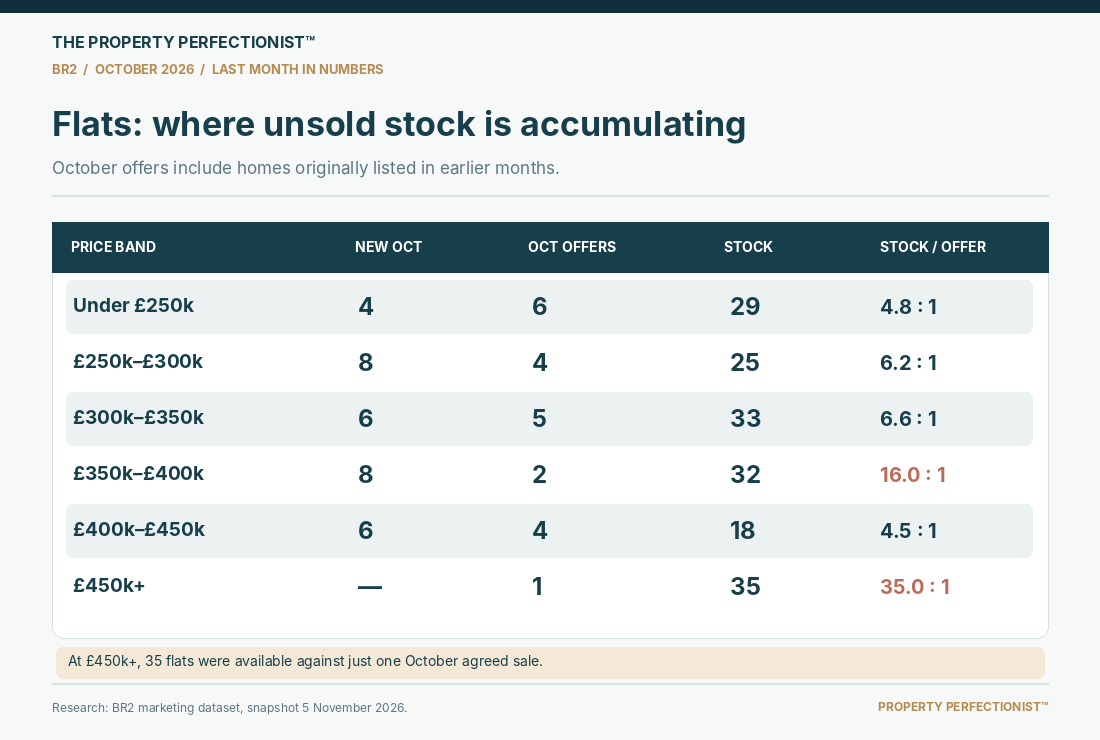
Two parts of the flat market stood out.
Between £300,000 and £400,000, 65 flats remained available, while seven properties in those two bands went under offer during October. At £450,000 and above, the figures were even more striking: 35 available flats against just one October agreed sale.
At the other end of the market, 23 of the 29 flats asking less than £250,000 had been listed for over 90 days. Some of the older stock is concentrated at Hopton Court, so it would be unwise to assume every property in this category competes with an ordinary first time buyer flat.
The evidence is not that flats cannot sell. Twenty two flats went under offer in October. It is that buyers have a great deal of choice, and certain price brackets are carrying a substantial backlog.
Houses: the price band changes everything
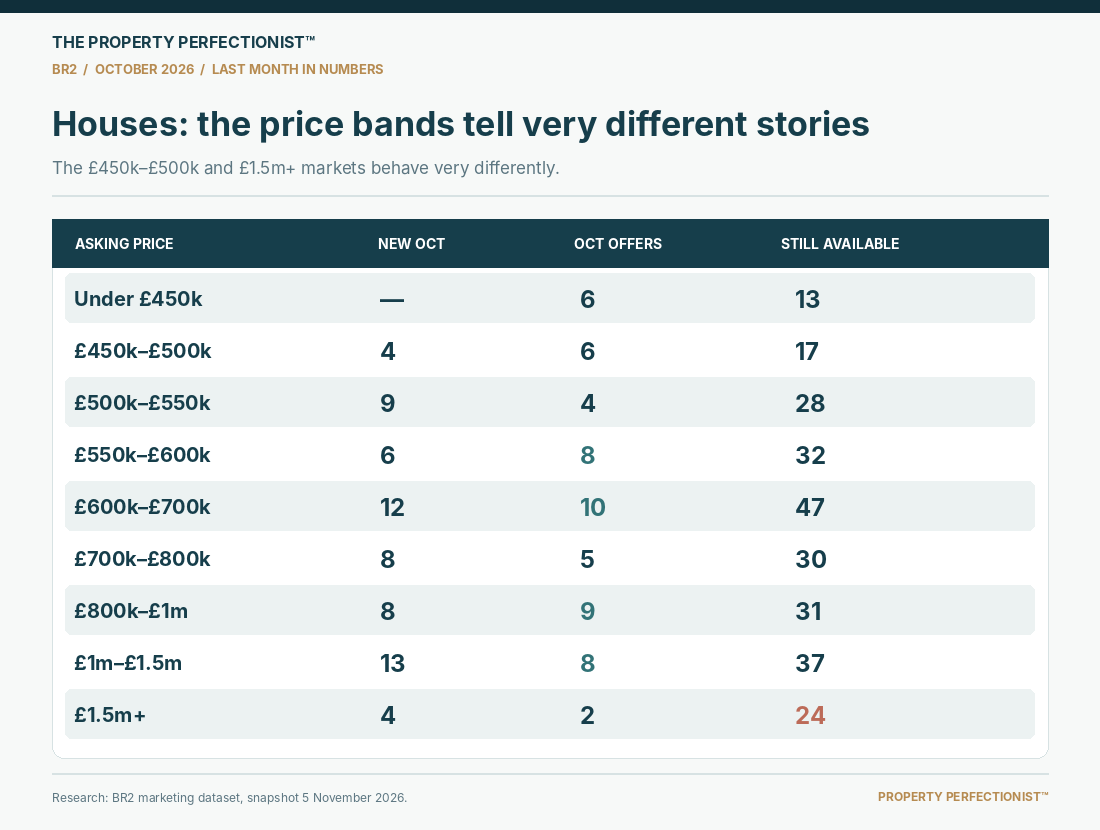
Houses produced a much more varied picture.
Between £450,000 and £500,000, six houses went under offer against 17 still available. Two of the four October launches in that band attracted offers before month end.
The £550,000 to £600,000 band recorded eight agreed sales, the largest total of any single house price band, but the median time to secure an offer was 123.5 days. There is demand, but it is not always translating into quick results.
The £1 million to £1.5 million bracket recorded eight agreed sales against 37 available houses, showing that the upper family house market is certainly not inactive.
Above £1.5 million, however, there were only two agreed sales against 24 available homes. This is a much more selective market, with substantial competition for the buyers who are active.
The most meaningful comparison is therefore not with the average BR2 house. It is with the homes a buyer can choose at a similar price, in similar locations, offering a similar lifestyle.
The Momentum Window™: when do offers happen?
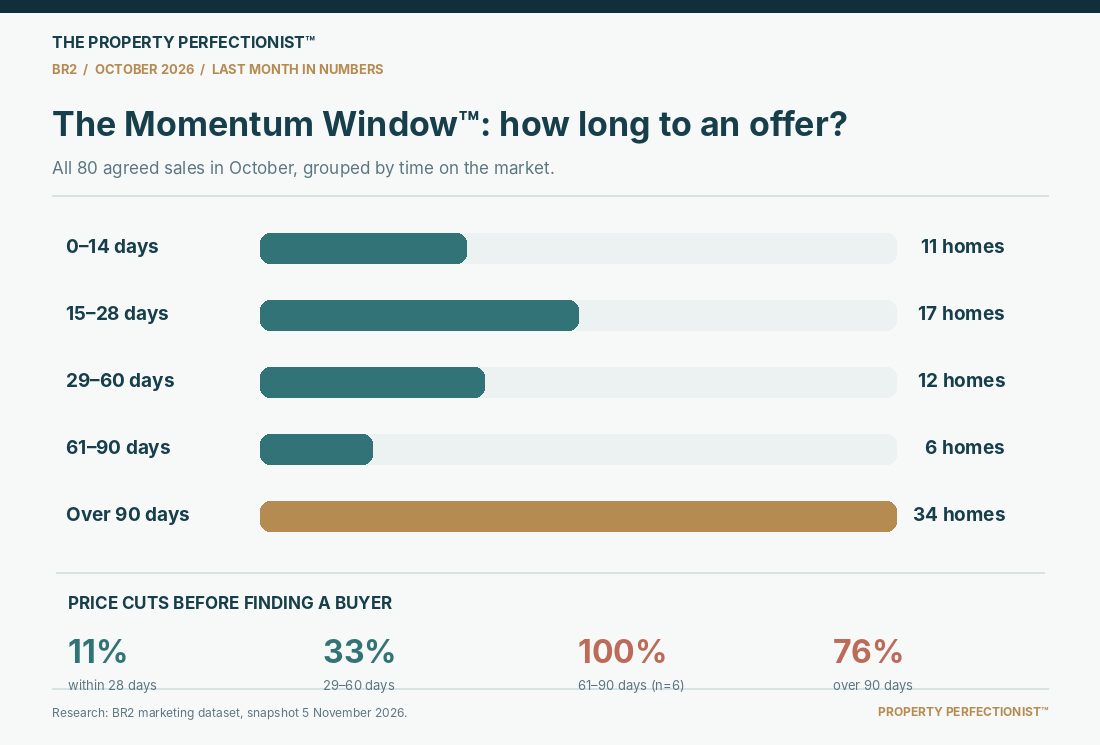
Of the 80 properties agreeing a sale during October, 28 found buyers within 28 days of launch. But 34 had been on the market for more than 90 days.
Here’s where the investigation becomes particularly revealing.
Of the 28 homes securing buyers within 28 days, only three had a recorded asking price reduction. That’s 11%.
Of the 34 taking over 90 days, 26 had been reduced. That’s 76%.
The six homes finding buyers between days 61 and 90 had all experienced reductions, although that’s a small group and shouldn’t be generalised to the whole market.
These figures don’t prove that reducing the price causes a delay or that a fast sale always means perfect pricing. Homes which struggle are naturally more likely to be reduced. But the relationship between prolonged marketing and reductions is unmistakable in this sample.
This is why I talk about the Momentum Window™. Your launch is an opportunity to get the photography, presentation, pricing and promotion right while the property is fresh in buyers’ minds.
What happened after October’s price reductions?
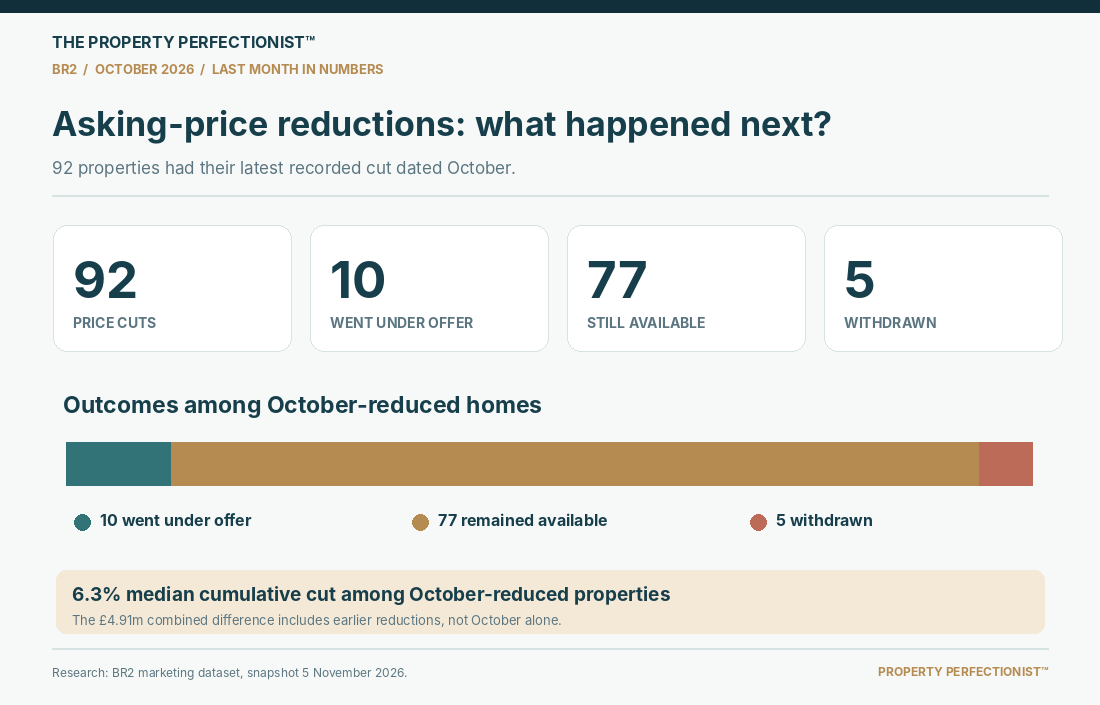
Ninety two properties had their latest recorded asking price reduction dated October. Only ten went under offer during the same month. Another 77 remained available at 31 October, and five were withdrawn.
The median cumulative reduction for those properties was 6.3%. Their combined asking prices stood approximately £4.91 million below their original launch prices.
Importantly, that £4.91 million includes reductions made before October. It is not the value of cuts made in October alone, nor is it a loss against confirmed completed sale prices.
A reduction may help a property reach a more competitive position. But if the presentation, layout, condition, tenure or buyer expectations are the real obstacle, a new asking price doesn’t necessarily solve the problem.
BR2 is not one market. Here are the local differences.
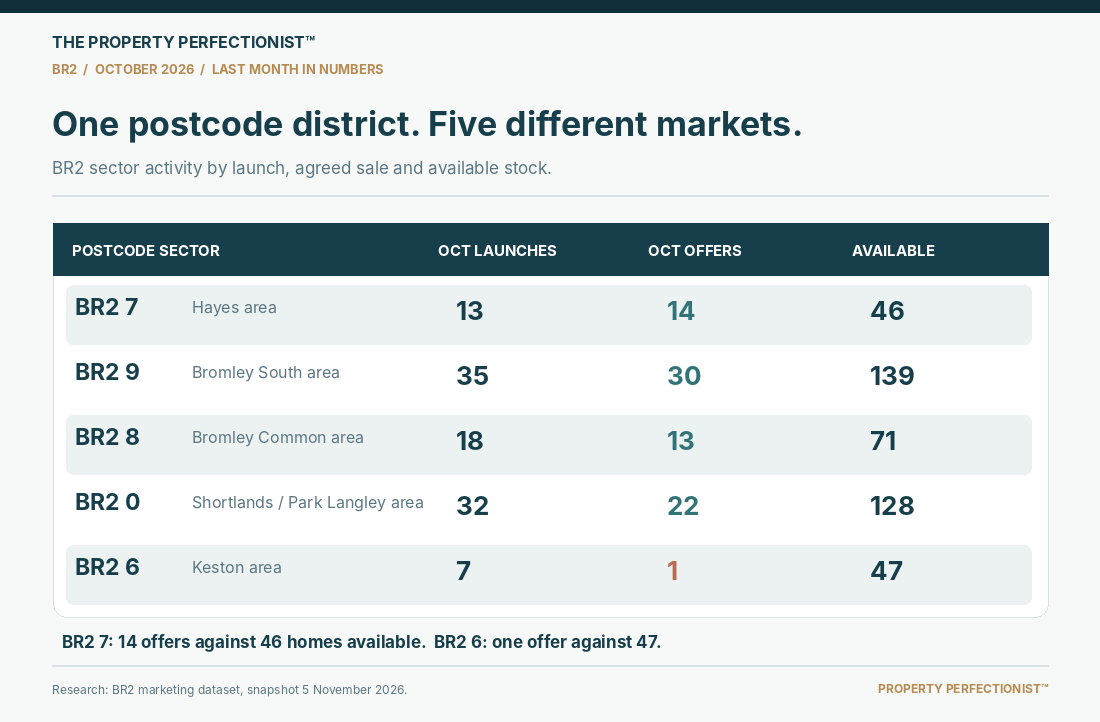
BR2 7, covering parts of Hayes, recorded 14 agreed sales against 46 homes remaining available. The median time taken to find a buyer among October’s agreed sales was 39.5 days.
BR2 9, around Bromley South and neighbouring roads, was the busiest area, with 30 agreed sales. But of the 139 homes still available, 70 had been on the market for more than 90 days.
BR2 0, including parts of Shortlands and Park Langley, recorded 22 agreed sales against 128 available properties. Its 68 available flats were a notable concentration of unsold stock.
BR2 6, covering Keston, recorded just one agreed sale against 47 available homes. Twenty eight of those available homes were detached, so it would be misleading to compare this sector directly with a lower priced terraced house market.
Neighbourhood names here are approximate. The actual statistical comparisons are at postcode sector level, and each sector contains different property types and price points.
Are sellers asking more per square foot than buyers are choosing?
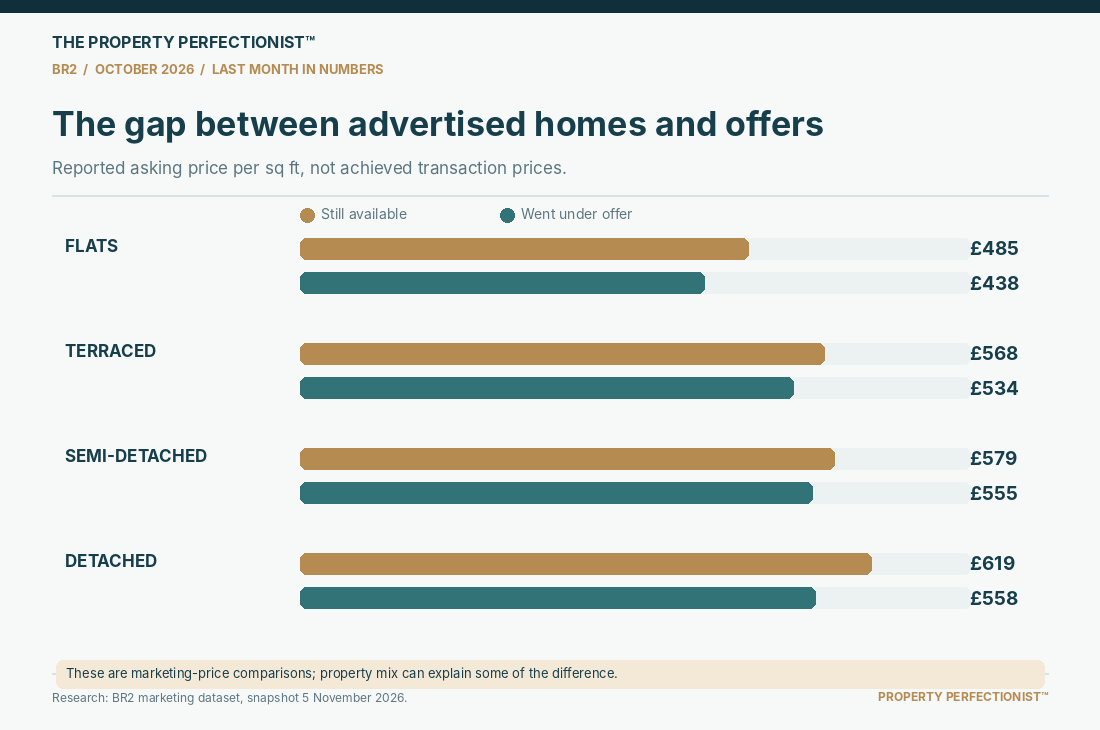
The price per square foot figures provide another useful clue.
For detached houses, homes remaining available had a reported asking price of approximately £619 per sq ft, compared with £558 per sq ft for homes going under offer. That is an 11% difference relative to the lower figure.
Terraced houses showed £568 against £534 per sq ft; semis £579 against £555; flats £485 against £438.
These are advertised price comparisons, not achieved sale price differences. They also reflect different mixes of properties, so they cannot prove an individual home is overpriced. But they reinforce the need to examine exactly what buyers are getting for their money.
Five properties that found buyers remarkably quickly
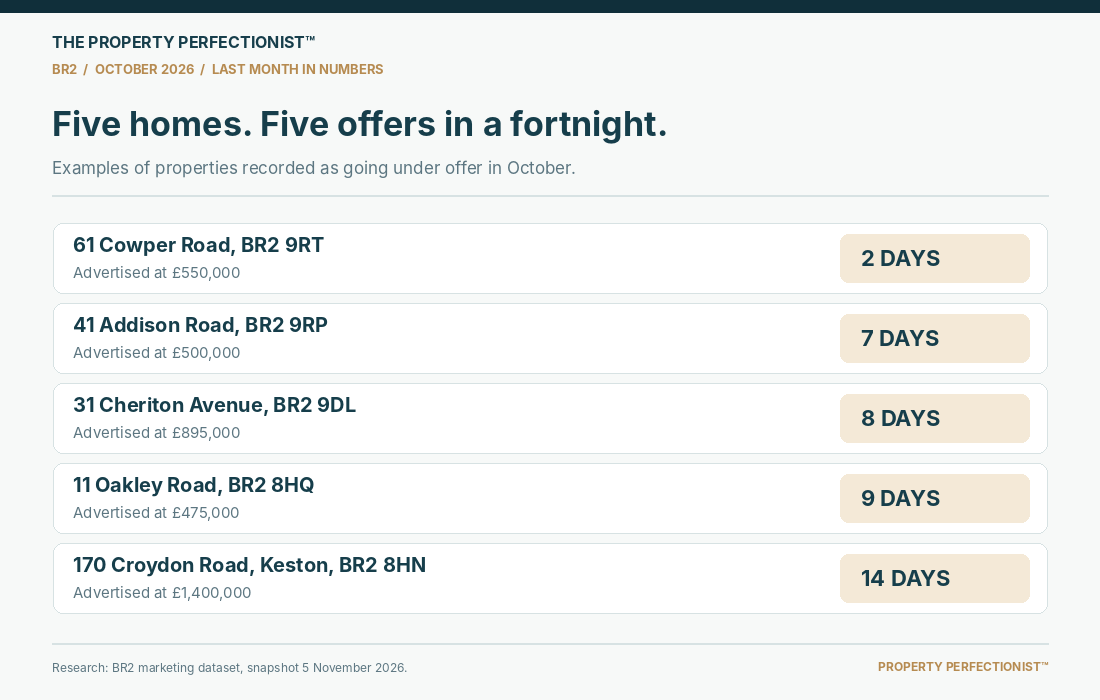
The individual property examples bring the figures to life.
61 Cowper Road, BR2 9RT, a three bedroom terraced home measuring approximately 958 sq ft, was advertised at £550,000 on 23 October and went under offer two days later.
41 Addison Road, BR2 9RP, another three bedroom terraced house, went under offer in seven days at an advertised £500,000.
31 Cheriton Avenue, BR2 9DL, a four bedroom detached house advertised at £895,000, took eight days.
11 Oakley Road, BR2 8HQ, advertised at £475,000, went under offer in nine days.
And 170 Croydon Road, Keston, BR2 8HN, a five bedroom detached house advertised at £1.4 million, went under offer in just 14 days.
None of these five fast moving examples had a recorded asking price reduction.
But compare those campaigns with 27 Scotts Avenue, BR2 0LG, a five bedroom detached home originally advertised at £2 million. After approximately 220 days and a reduction to £1.6 million, it went under offer in October.
Or 97 Turpington Lane, BR2 8JD, where the advertised price moved from £475,000 to £395,000. The latest reduction was recorded on 3 October and the property went under offer on 13 October.
I don’t have the completed sale prices for these October agreements. What I do have are very different marketing journeys, and those differences deserve investigation rather than guesswork.
What about the estate agents?
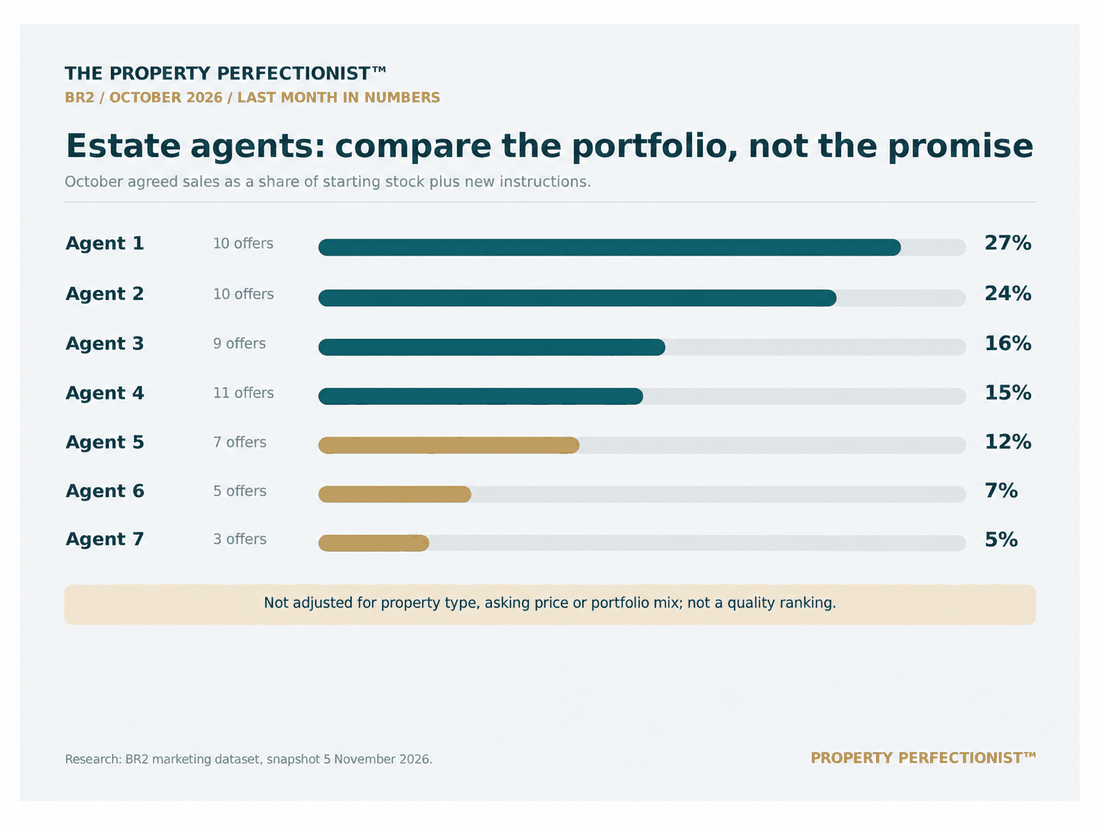
The data also provides a snapshot of agents’ advertised portfolios.
Agent 1 recorded ten agreed sales, equivalent to approximately 27% of its starting stock plus October instructions. Agent 2 also recorded ten, equivalent to approximately 24%. The corresponding figures for Agent 6 and Agent 7 were 7% and 5%.
This is not an adjusted estate agent league table. Agents have different mixes of flats, houses, price ranges and property conditions, and the numbers are relatively small. A few transactions can move these percentages considerably.
Nevertheless, it raises a worthwhile question for homeowners. Rather than simply asking an agent how many properties they have for sale, ask how those listings are performing, how long they have been available and what happens when buyer interest starts to fade.
My Property Perfectionist™ verdict
October doesn’t support the blanket statement that the BR2 market is either booming or collapsing.
Buyers were active across several price brackets, and some homes found buyers within days. Yet more than half of the available stock had already been marketed for over 90 days, flats were facing substantial competition, and the most expensive house market was particularly selective.
The distinction is not simply between expensive and inexpensive properties. It is between homes that offer buyers a compelling proposition and homes that are struggling to stand out against their competition.
If your home has been on the market for several months, the most useful question isn’t automatically whether you should reduce the asking price again.
It’s why buyers are choosing other properties instead, and what needs to change to give them a reason to look at yours.
Buyers decide value. Buyers compare. And every unsold property leaves clues.
If you’re selling in Bromley South, Hayes, Shortlands, Keston or elsewhere in BR2, I offer a free Property Perfectionist™ Market Intelligence Report to examine how your home compares with the properties buyers are actually choosing.
Request your FREE Market Intelligence Report:
propertyperfectionist.co.uk/market-report
Clarity. Not optimism. Not guesswork. Just evidence.
James Hall | The Property Perfectionist™
Independent Estate Agent | Powered by eXp UK
james.hall@expuk.com | 07855 828 736
Research note: This report covers BR2 residential marketing records for October 2026, using information available on 5 November 2026. The data combines under offer and SSTC events, which are not completed sales. Asking prices are not achieved transaction prices. The available stock at the start of October is reconstructed, rather than an independently observed snapshot. Relisting history and the timing of multiple reductions may be incomplete. Two sales and nine listings classified as other property types were excluded.
Get the Bromley Market Briefing
Local property intelligence for Bromley and South East London, straight to your inbox. Evidence, not guesswork. Unsubscribe any time.


Leave a Reply