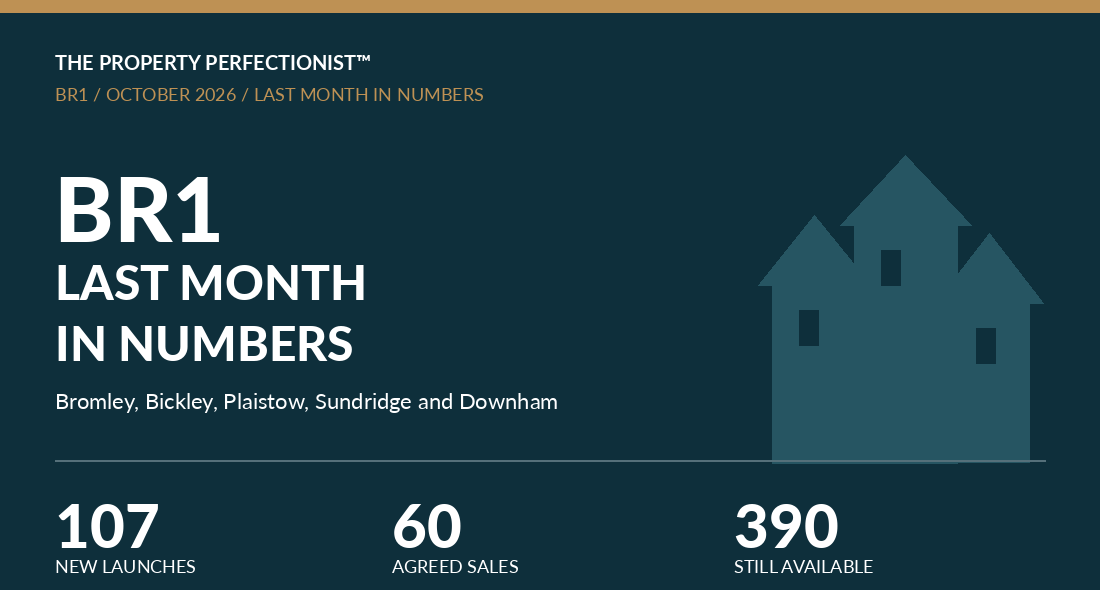
The Property Perfectionist™ | October 2026 | Data snapshot: 5 November 2026
107 properties withdrawn. Just 60 sales agreed. And nearly half the homes still for sale had already been advertised for more than 90 days.
That’s what the BR1 property records reveal about October 2026. But the figures tell a more interesting story than simply saying the property market is slow.
Some homes attracted buyers in four days. Others have been on the market for hundreds of days. Terraced houses were finding buyers in a median of 35 days, while flats took 101.5 days. And in one postcode sector, buyers agreed 20 purchases while another managed eight.
I’m James Hall, The Property Perfectionist™, and I wanted to understand why. I examined the available marketing evidence for Bromley, Bickley, Plaistow, Sundridge, Downham and the wider BR1 postcode district.
What actually happened in BR1 during October?
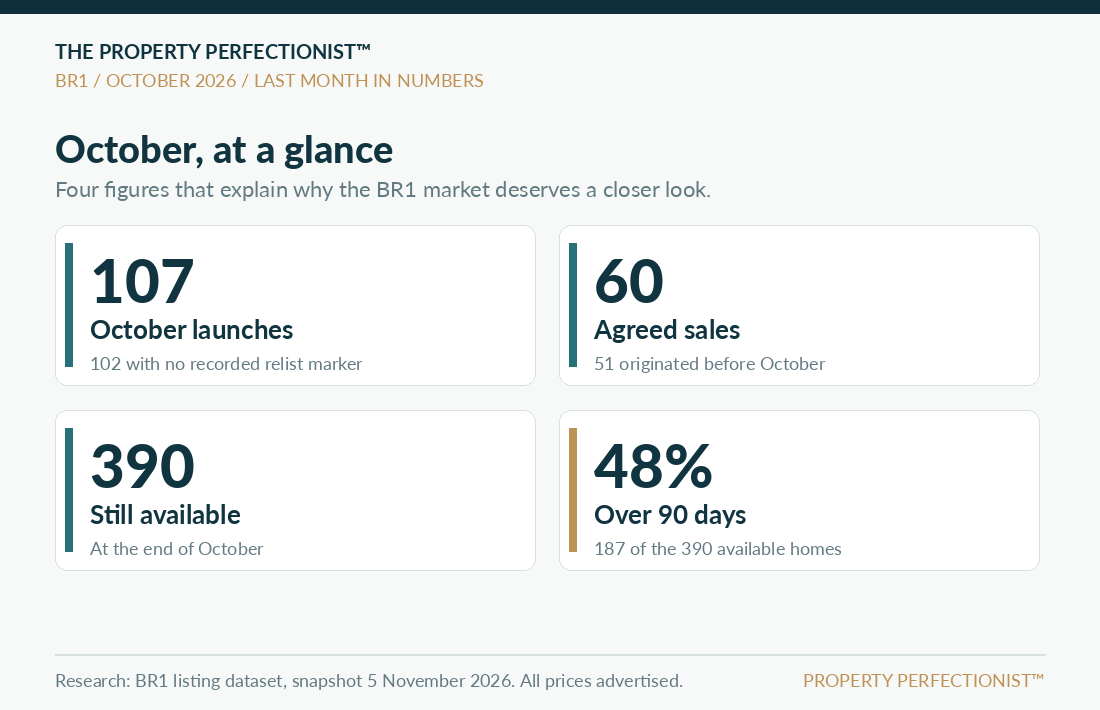
The dataset records 107 October property launches, of which 102 had no recorded relisting marker. During the same period, 60 homes went under offer or sold subject to contract.
These are two different groups. Of the 60 properties agreeing sales, 51 had been advertised before October. Only nine of the 107 new October campaigns were under offer by 31 October, giving an early launch success rate of 8.4%.
There were also 107 withdrawals and 14 previously agreed sales recorded as having fallen through. The estimated available stock reduced from 451 to 390 homes, a fall of 13.5%.
That decline in available stock might sound encouraging. But withdrawals greatly outnumbered agreed sales. A smaller number of listings does not, on its own, mean the market has become more active.
It is also important to recognise that late October launches had very little time to find a buyer by the 31 October measurement date. The 8.4% figure is an early snapshot, not a final selling success rate.
Four types of property. Four very different markets.
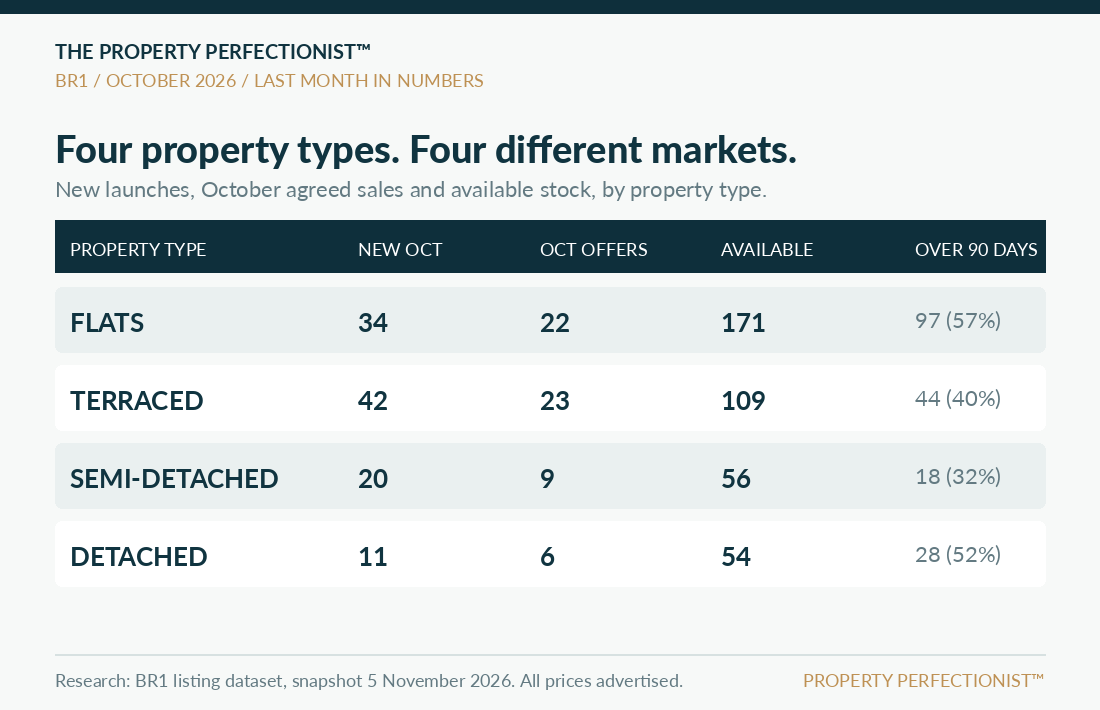
During October, 23 terraced houses, 22 flats, nine semi detached houses and six detached houses went under offer.
Terraced houses delivered the quickest median marketing period at just 35 days. Detached houses had a median of 46 days, semi detached homes took 62 days, and flats took 101.5 days.
The other big difference is the weight of unsold stock. By 31 October, 171 flats were still advertised, including 97 that had been marketed for more than 90 days. That’s around 57% of the available flats.
For terraced houses, there were 109 available, with 44 marketed for more than 90 days. Around 40%.
There are clearly active buyers in BR1. But a flat seller is operating in a very different competitive environment from someone selling a mainstream terraced house.
Flats: a particularly demanding market
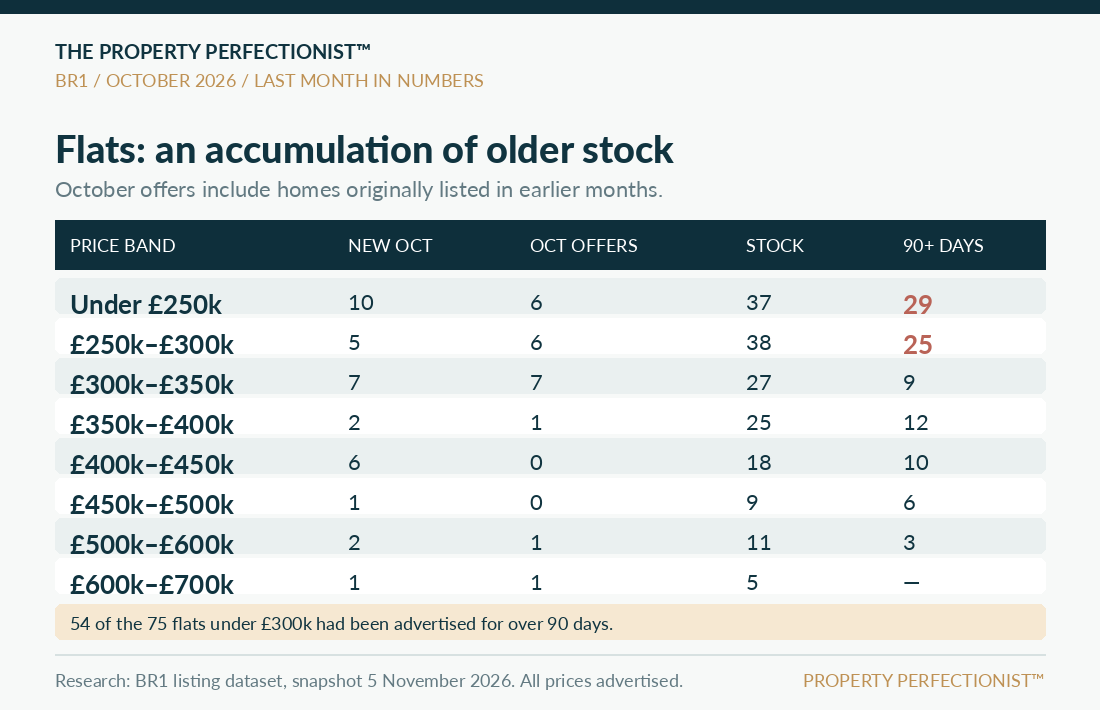
There were 75 flats advertised below £300,000 at the end of October. Fifty four of them had already been marketed for more than 90 days.
Between £400,000 and £500,000, 27 flats remained available and the data recorded no new agreed sales during October in those bands.
The market was not completely inactive. Seven flats priced from £300,000 to £350,000 went under offer during October, and there were six agreements in each of the two bands below £300,000.
The more useful conclusion is not that all flats are overpriced. It’s that buyers have substantial choice. Lease terms, service charges, building management, outdoor space, layout, floor level and presentation can all make two apparently similar apartments very different propositions.
For a flat owner struggling to secure viewings, understanding exactly which alternatives buyers can choose is often more valuable than simply comparing average postcode prices.
Houses: where are buyers actually active?
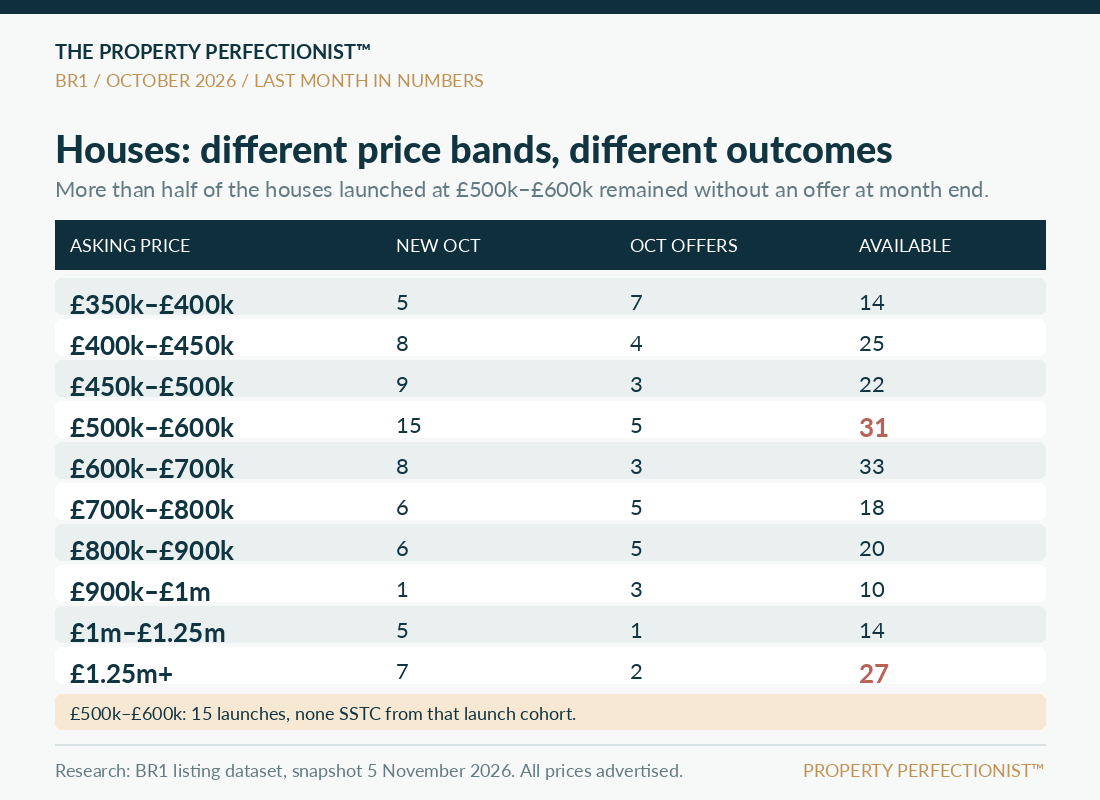
The £350,000 to £400,000 house band recorded seven agreed sales against only 14 available properties at month end. In the £700,000 to £800,000 band, five homes went under offer against 18 remaining available.
Yet the £500,000 to £600,000 bracket tells a different story. Fifteen houses were first advertised during October, but none of those 15 had agreed a sale before month end. Five older listings in that price band did secure buyers.
At the higher end, the £1.25 million and above brackets held 27 available houses against two October sale agreements. Larger homes inevitably have smaller buyer pools, so this doesn’t mean the entire premium market is failing. It does, however, suggest greater competition for each active purchaser.
These distinctions matter. A seller should be judging their property against what a buyer can actually purchase at a similar price, not the BR1 average.
The Momentum Window™: why the first few weeks matter
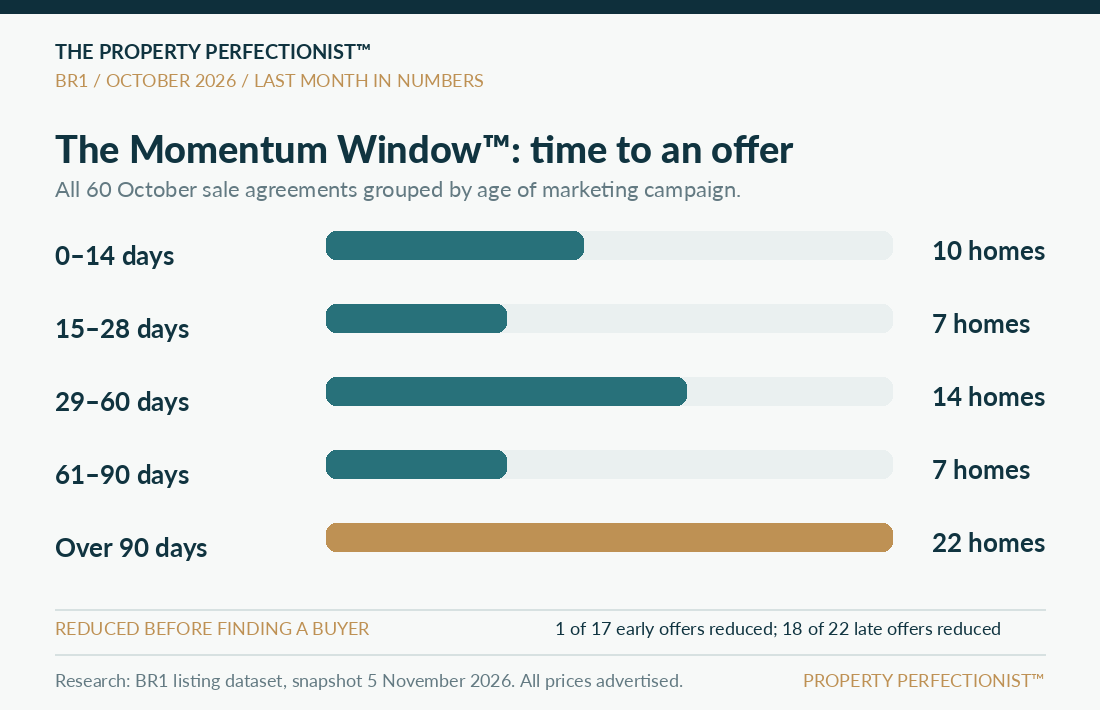
I use the term Momentum Window™ for the period when a property is fresh to the market and has its best opportunity to capture immediate buyer attention.
In October, 17 of the 60 agreed sales involved homes that found buyers within 28 days of their recorded listing date. Only one of those 17 had an asking price reduction recorded before securing a buyer.
By contrast, 22 properties took more than 90 days to agree a sale. Eighteen of those 22, or 82%, had been reduced.
These figures don’t prove that a price reduction causes a delay, or that every quick sale was perfectly priced. Homes that struggle naturally have more opportunities to be reduced. But they show a strong association between prolonged marketing and later price changes.
This is why I believe the preparation before a property goes live is so important. Photography, presentation, video, the quality of the listing, advertising and pricing all need to work together from day one.
What happened after October’s asking price reductions?
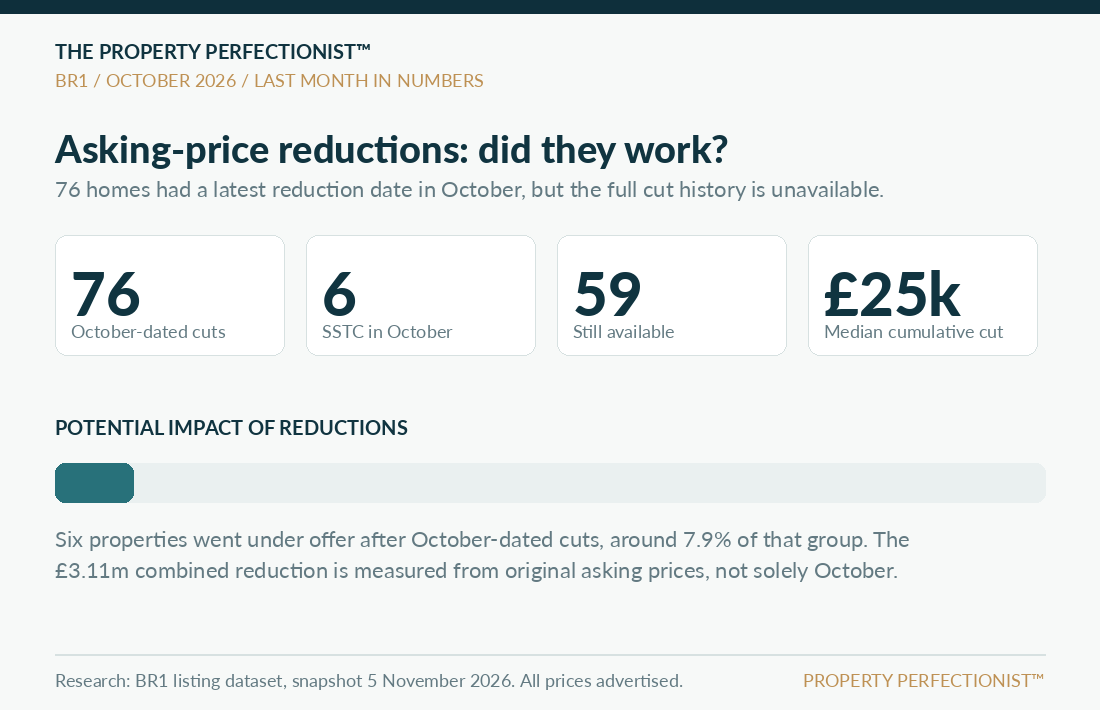
76 BR1 properties had their latest recorded price reduction dated during October. Of these, six went under offer after the cut during the month, while 59 were recorded as still available in the latest snapshot.
The median cumulative reduction was £25,000, approximately 5.8%. Across those properties, the combined difference between original and later advertised asking prices was about £3.11 million.
That £3.11 million is not the amount reduced solely during October. The dataset retains cumulative reductions since launch, and it is not evidence of money lost against completed sale prices.
A reduction sometimes does the job. But if a property is struggling for reasons other than its headline price, simply changing the number may not generate new demand. Presentation, floor space, specification, location, legal issues and competition all play a part.
BR1 is five postcode sectors, not one market
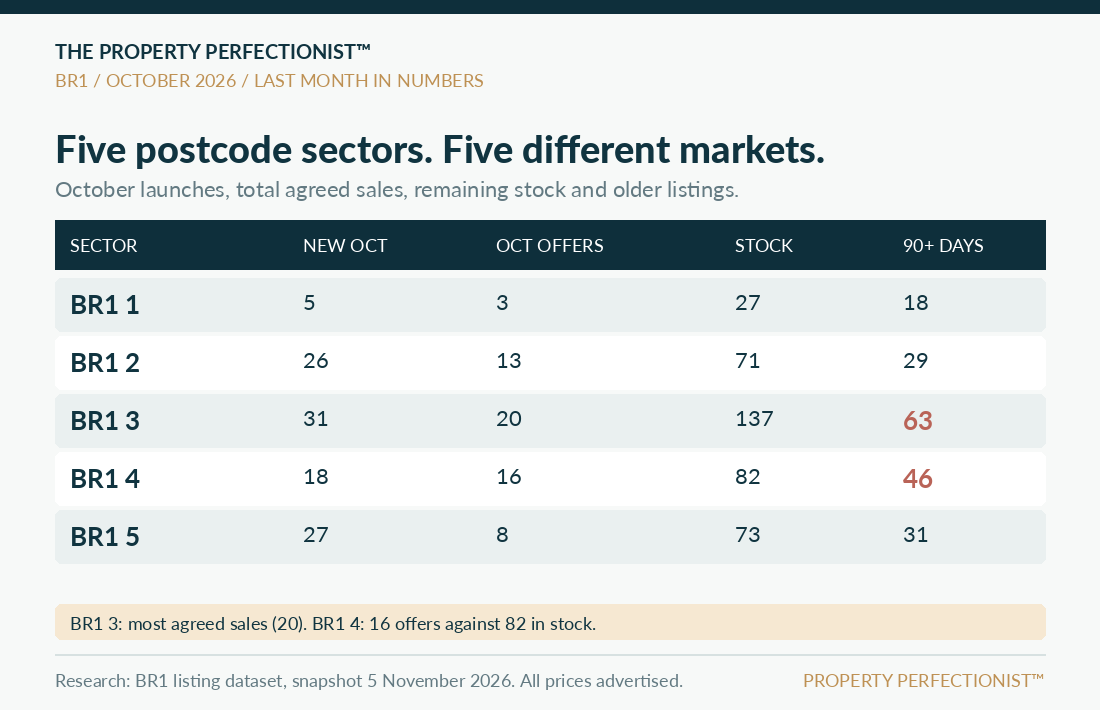
BR1 3, covering parts of Plaistow and Sundridge, recorded the highest volume of agreed sales, with 20 during October. But 63 of its 137 available homes had been marketed for more than 90 days.
BR1 4, including Burnt Ash, London Lane and the Downham borders, recorded 16 agreed sales against 82 remaining available homes. Flats and terraced houses accounted for much of the activity.
BR1 2, covering parts of Bickley and Widmore, recorded 13 agreed sales and 29 withdrawals. Its median asking price of available homes was £650,000, notably above most of the other sectors.
BR1 5, covering parts of Downham and Whitefoot Lane, recorded eight agreed sales against 73 available homes. Only one of 27 October launches found a buyer by month end.
BR1 1, around the town centre, was a smaller market with three agreed sales and 27 homes still available. Its sample is too small for sweeping conclusions.
Neighbourhood names are approximate. These are postcode sector statistics, and local property types and price ranges differ considerably from one sector to another.
Does price per square foot help explain the differences?
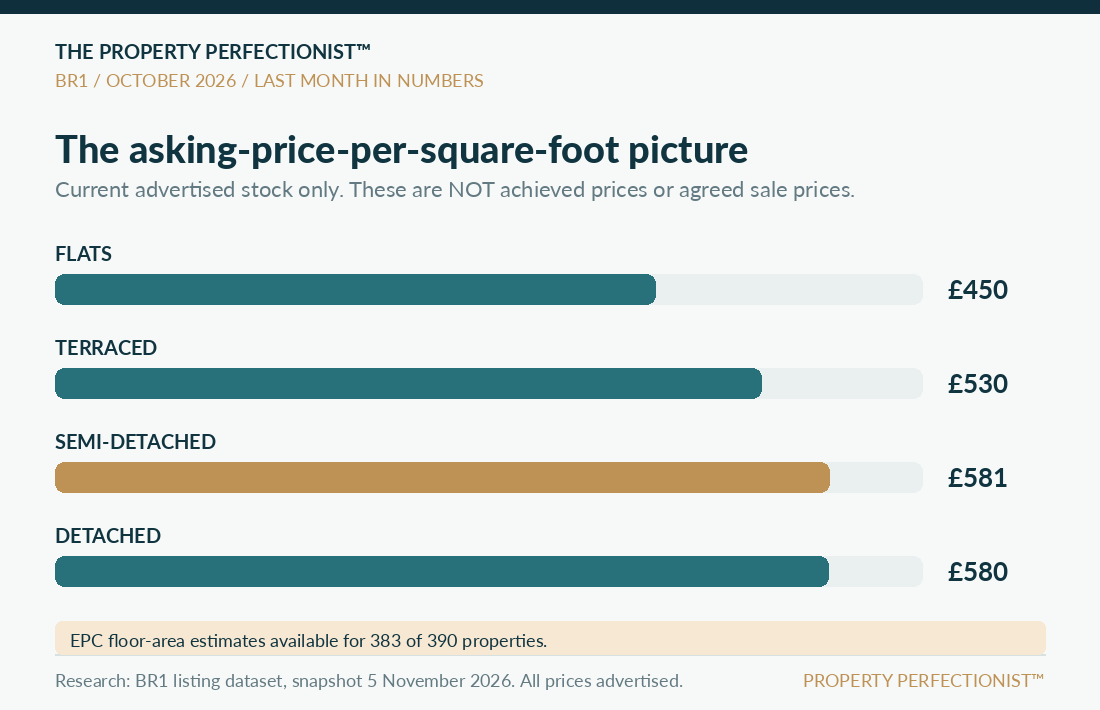
The available stock in BR1 showed median advertised prices of approximately £450 per sq ft for flats, £530 for terraced houses, £581 for semi detached homes and £580 for detached houses.
These are not achieved sale prices. They describe the asking prices of homes that were still available, based on floor areas recorded in the dataset.
Price per square foot is only one clue. Location, condition, layout, outdoor space and quality of accommodation can matter just as much. But it can reveal when one property is competing against homes that offer substantially more space for similar money.
Five homes that found buyers in nine days or less
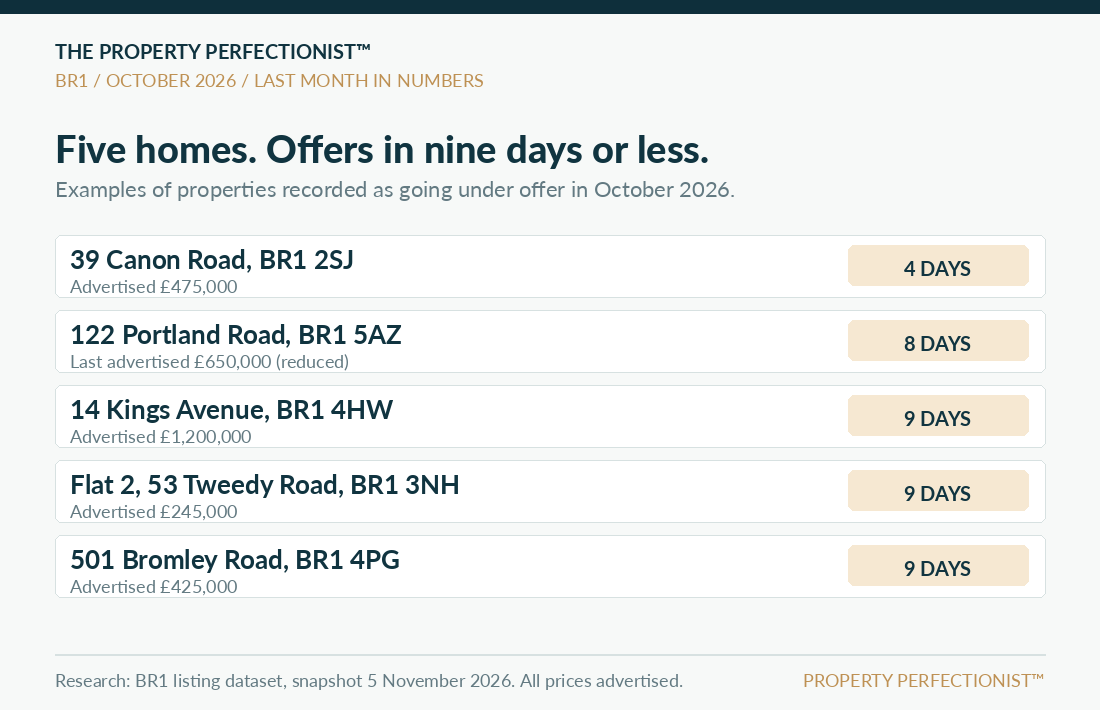
The individual examples help bring the numbers to life.
39 Canon Road, Bromley BR1 2SJ, a two bedroom terraced home of approximately 936 sq ft, was advertised at £475,000 on 2 October and went under offer on 6 October. Four days.
122 Portland Road, Bromley BR1 5AZ, a four bedroom detached house, was initially advertised at £675,000 and subsequently reduced to £650,000. It went under offer eight days after its recorded launch date.
14 Kings Avenue, Bromley BR1 4HW, a five bedroom semi detached home of approximately 2,799 sq ft, was advertised at £1.2 million and went under offer in nine days without a recorded reduction.
Flat 2, 53 Tweedy Road, Bromley BR1 3NH, a two bedroom flat advertised at £245,000, also took nine days.
And 501 Bromley Road, Bromley BR1 4PG, a three bedroom terraced house advertised at £425,000, went under offer nine days after its September launch.
These examples show that genuine buyer activity existed across a wide range of homes and price points. The advertised figures are not confirmed sale prices.
Two similar homes. Completely different outcomes.
One particularly interesting comparison is in BR1 4.
14 Kings Avenue, Bromley BR1 4HW, offering approximately 2,799 sq ft and advertised at £1.2 million, went under offer in nine days.
3 Minster Road, Bromley BR1 4DY, also a five bedroom semi detached house advertised at around £1.2 million, offered approximately 2,153 sq ft and remained unsold after 156 days.
At very similar advertised prices, the first property offered about 30% more internal space. That does not tell us everything about condition or location, but it gives us a meaningful clue about what buyers were comparing.
On London Lane, Flat 48, Russell Court, BR1 4HX, a one bedroom flat of approximately 538 sq ft advertised at £260,000, went under offer in 12 days. Flat 11, Regents Court, BR1 4NZ, also advertised at £260,000 but measuring approximately 495 sq ft, remained available after 205 days.
Again, floor space alone cannot explain everything. But the useful question is why buyers chose one property rather than the other. That’s where a more detailed investigation begins.
What does the agency performance data tell us?
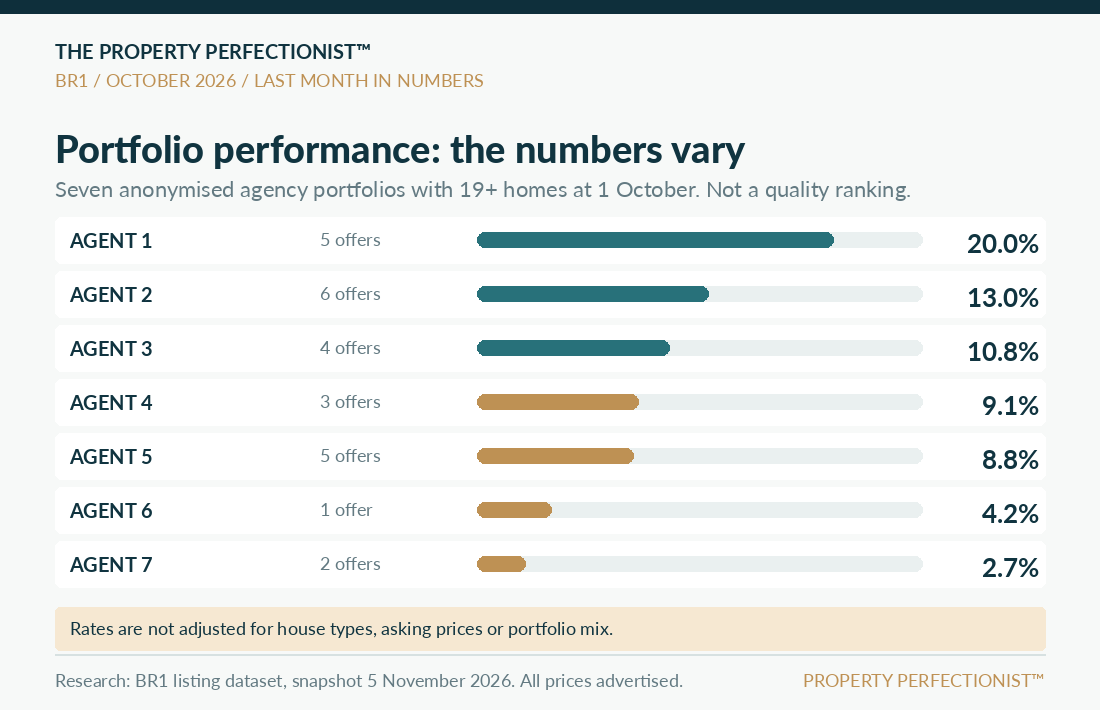
The research also contains a snapshot of estate agency portfolios. I’ve anonymised this comparison as Agent 1 through Agent 7, rather than naming individual firms.
Among these seven larger portfolios, the recorded October portfolio sales rates ranged from approximately 2.7% to 20%. The measure is the number of October agreed sales divided by the agent’s available stock at the beginning of October plus new launches in the month.
These are not adjusted success rates or a ranking of agent quality. Different companies handle very different mixes of flats, family houses, price ranges and property conditions. The sample sizes are also small. Nevertheless, it is worth asking an agent what percentage of their comparable homes are going under offer, how long those properties are taking and what they change when interest disappears.
The Property Perfectionist™ verdict
October’s figures don’t support the blanket claim that nobody is buying in BR1.
Sixty properties found buyers during the month, including examples across mainstream family housing and higher value homes. Yet 107 properties were withdrawn, and almost half the remaining available stock had already been marketed for over three months.
The strongest segment in this dataset was terraced housing, with the shortest median marketing period and the largest number of agreed sales. The most difficult segment was flats, where old stock was particularly concentrated.
For anyone selling their home, I would focus on three questions: Which homes are buyers choosing instead? Does my property present as better value than those alternatives? And is my marketing creating a compelling reason for buyers to act now?
After over 18 years working in property, I’ve learnt that a good home rarely struggles to sell for one simple reason. The answer usually lies in understanding buyer behaviour, presentation, competition and market positioning together.
If your BR1 property has been on the market longer than you expected, I’d be delighted to investigate the evidence with you.
No hard sell. Just clarity.
James Hall
The Property Perfectionist™ | Independent Estate Agent, powered by eXp
07855 828 736 | james.hall@expuk.com
Request your free Market Intelligence Report
Clarity. Not optimism. Not guesswork. Just evidence.
About this research
This October 2026 market analysis is based on a single BR1 property marketing data snapshot dated 5 November 2026. It includes flats and terraced, semi detached and detached houses, excluding 24 records in miscellaneous categories. Property records are deduplicated by unique property reference. Month start and month end stock are reconstructed estimates, not archived daily counts. Listing dates can reset on relisting. Under offer and SSTC mean agreed sales, not completed transactions, and every quoted price is advertised rather than confirmed achieved sale price. The number and full dates of individual price cuts are not available, so figures described as cumulative reductions must not be interpreted as cuts made solely in October. Unusual and inconsistent records have not been used to justify broader conclusions. This is market commentary, not a formal valuation.
What does this mean for your home?
Not ready for a visit? I can prepare a free Market Intelligence Report to show you the sales evidence and the homes buyers will compare with yours. There is no obligation.


Leave a Reply