The Property Perfectionist™ | Market intelligence
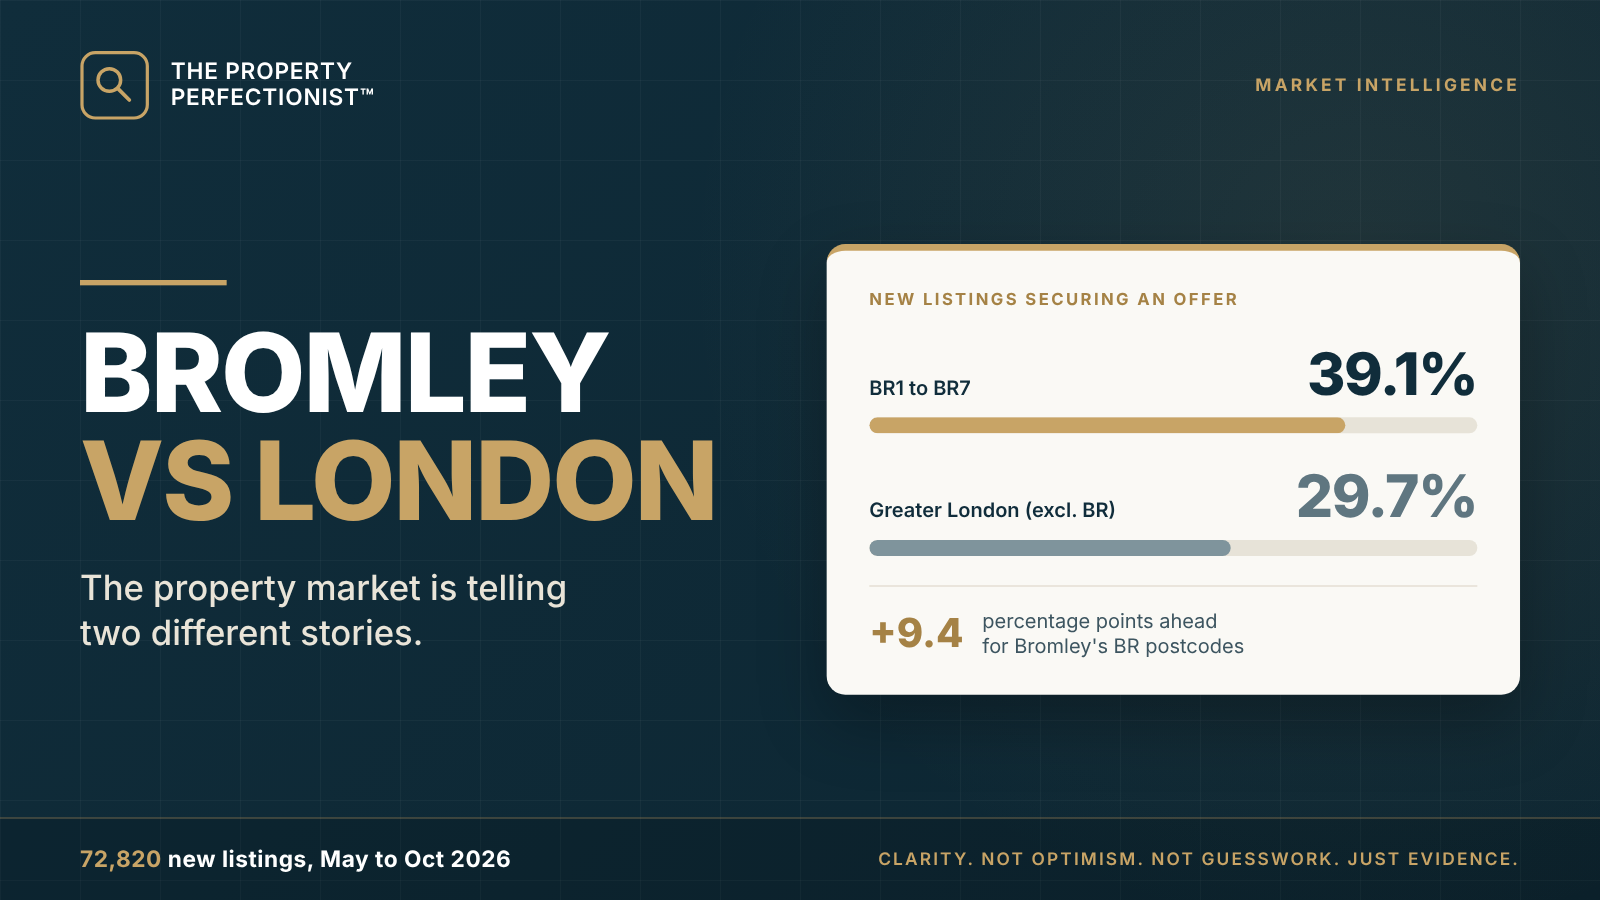
Six months. 72,820 new listings. A 9.4 percentage point advantage in offer conversion for BR1 to BR7.
If your home is currently on the market, it can be tempting to interpret everything through the national headlines. But buyers do not compare national averages. They compare the homes actually available to them.
I wanted to understand whether the differences between Bromley and wider London went beyond price changes and into actual buyer behaviour.
Six months. More than 72,000 new listings.
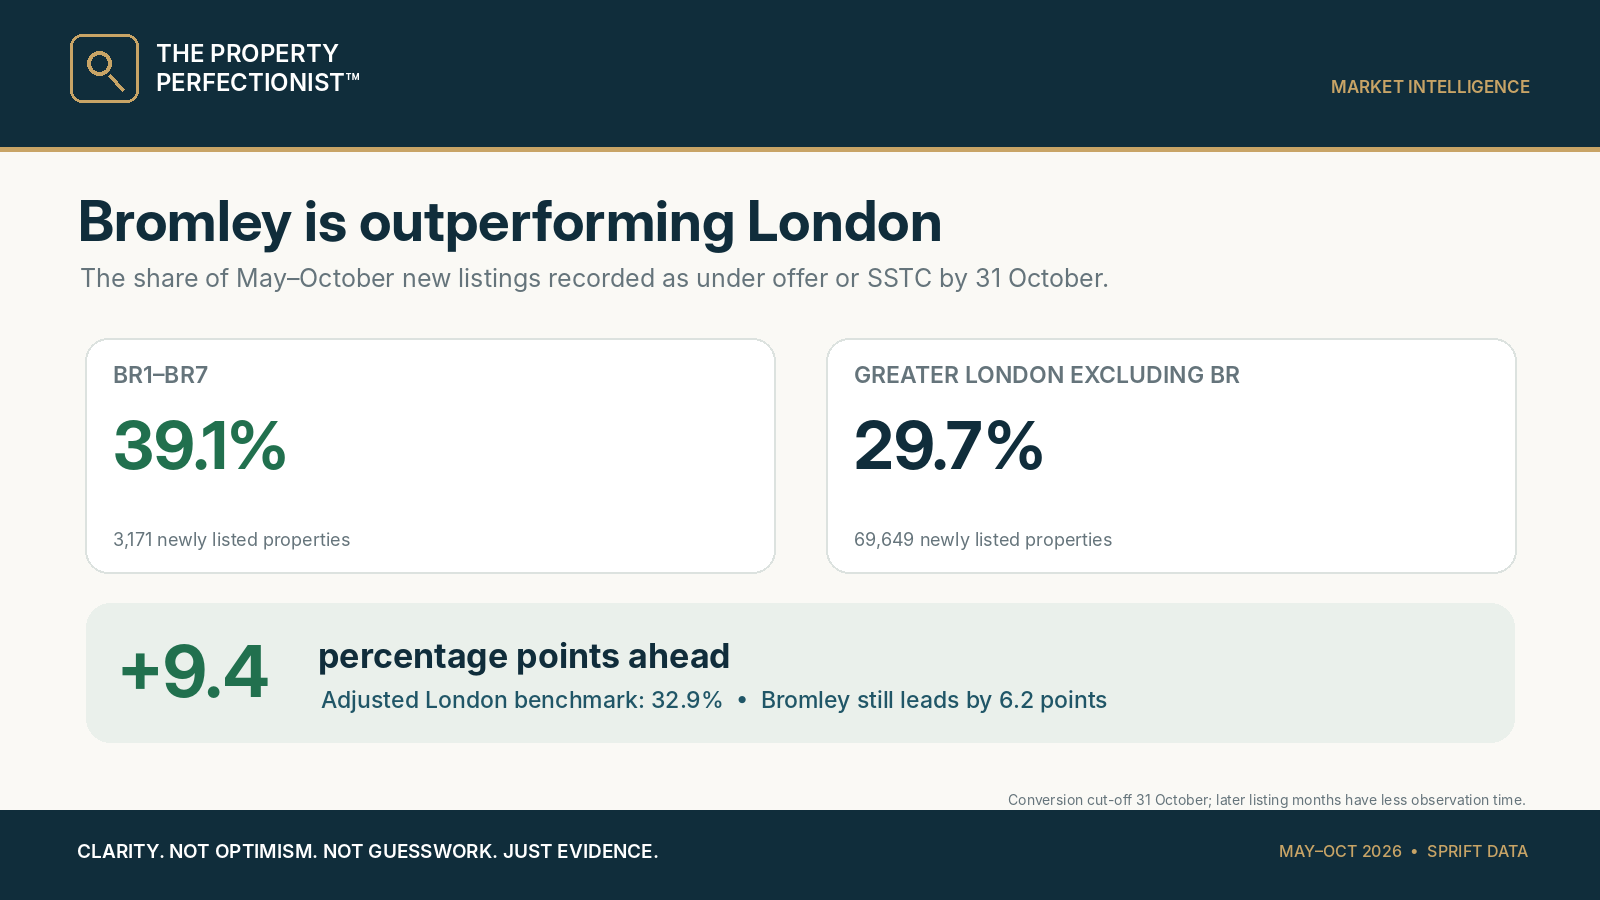
I examined 69,649 newly recorded listings across Greater London excluding BR postcodes, alongside 3,171 across BR1 to BR7. Rather than relying on broad market headlines, I focused on what happened to the properties: which attracted offers, how quickly, how often asking prices were reduced and how many listings were removed without an offer.
The first weeks matter
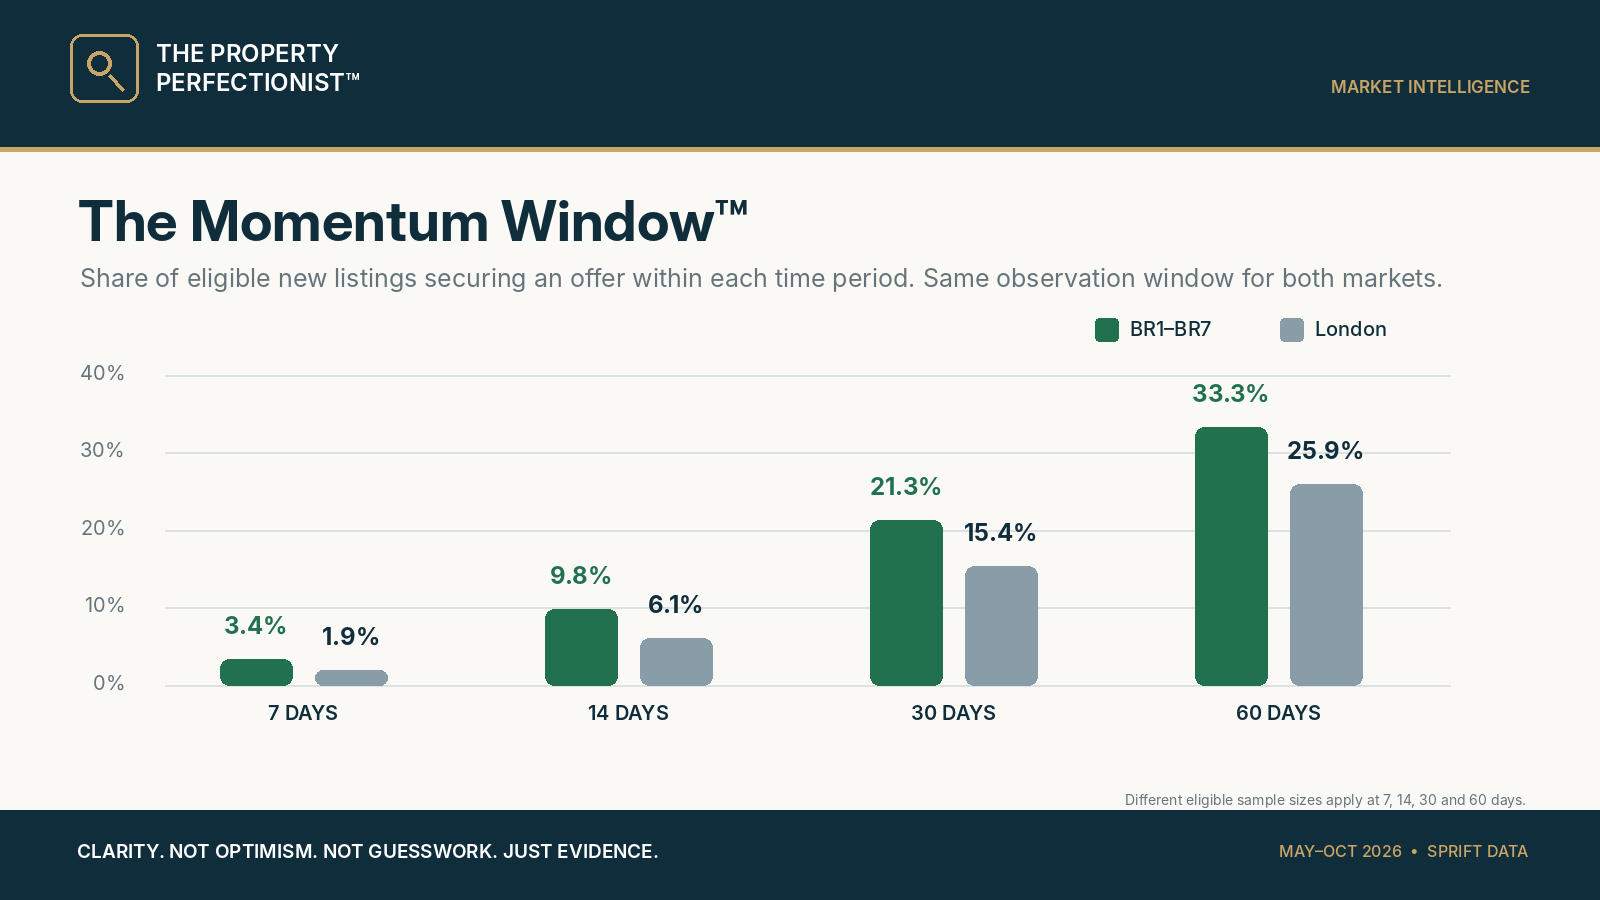
Bromley recorded an offer within 14 days on 9.8% of eligible listings, compared with 6.1% across wider London. At 60 days, the figures were 33.3% and 25.9%. My Momentum Window™ is about making a launch count, although the data cannot establish that the marketing launch itself caused these outcomes.
A reduction is not a strategy
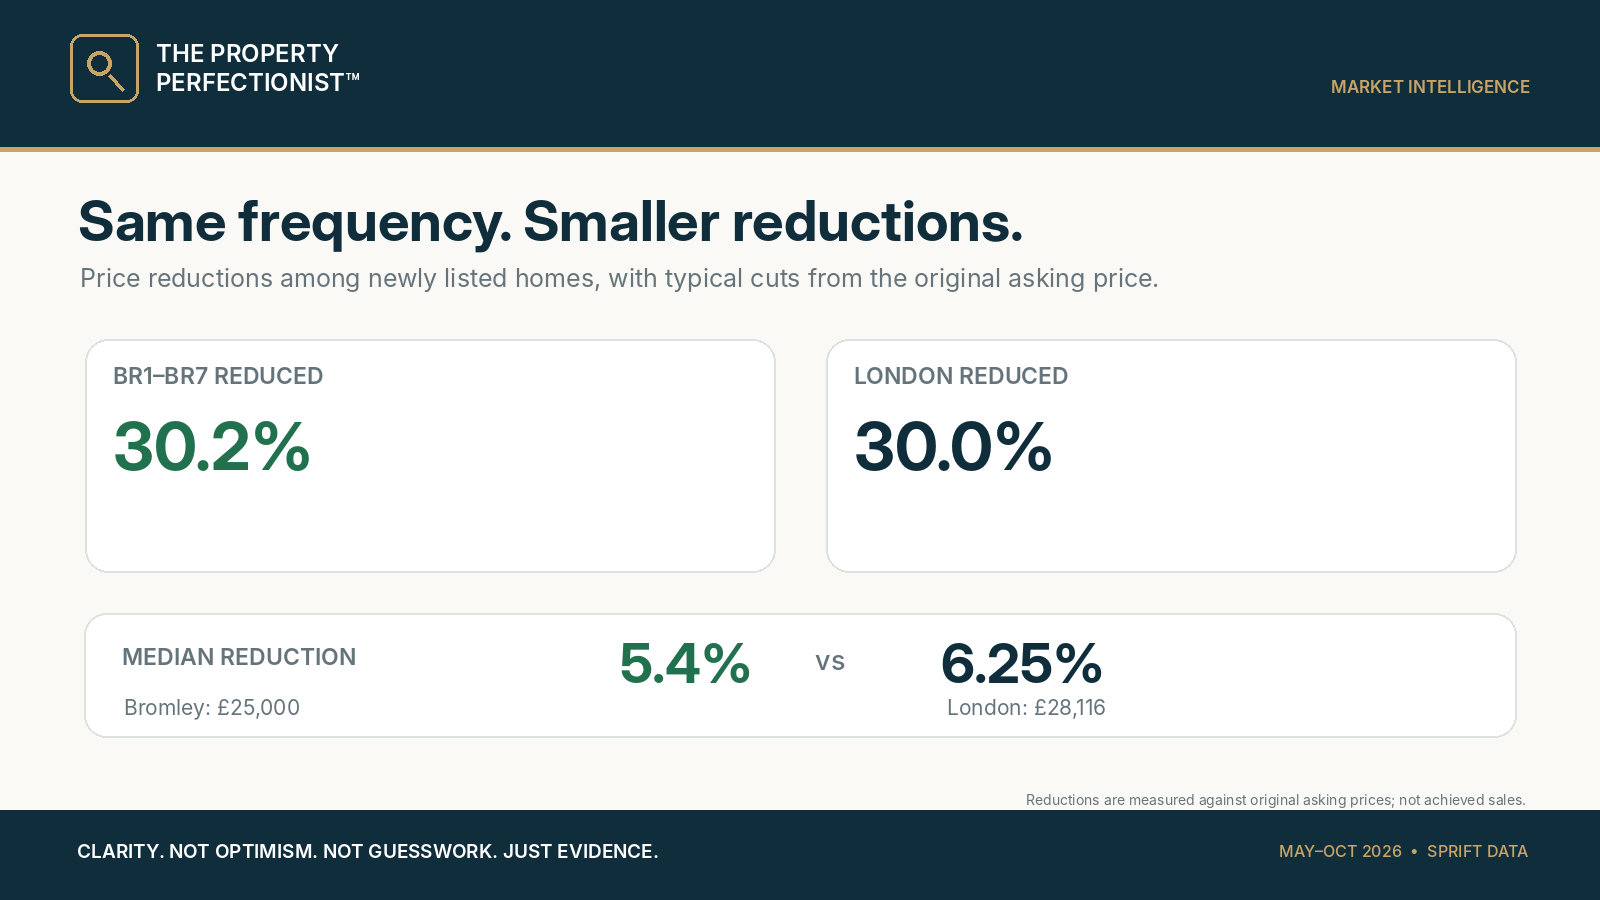
Almost the same share of new listings were reduced in each market: 30.2% in BR1 to BR7 and 30.0% in London. However, the median cut was smaller in Bromley, 5.4% compared with 6.25%. A price reduction makes most sense when considered alongside competition, buyer response and the property’s position in search results.
More listings are removed without an offer in London
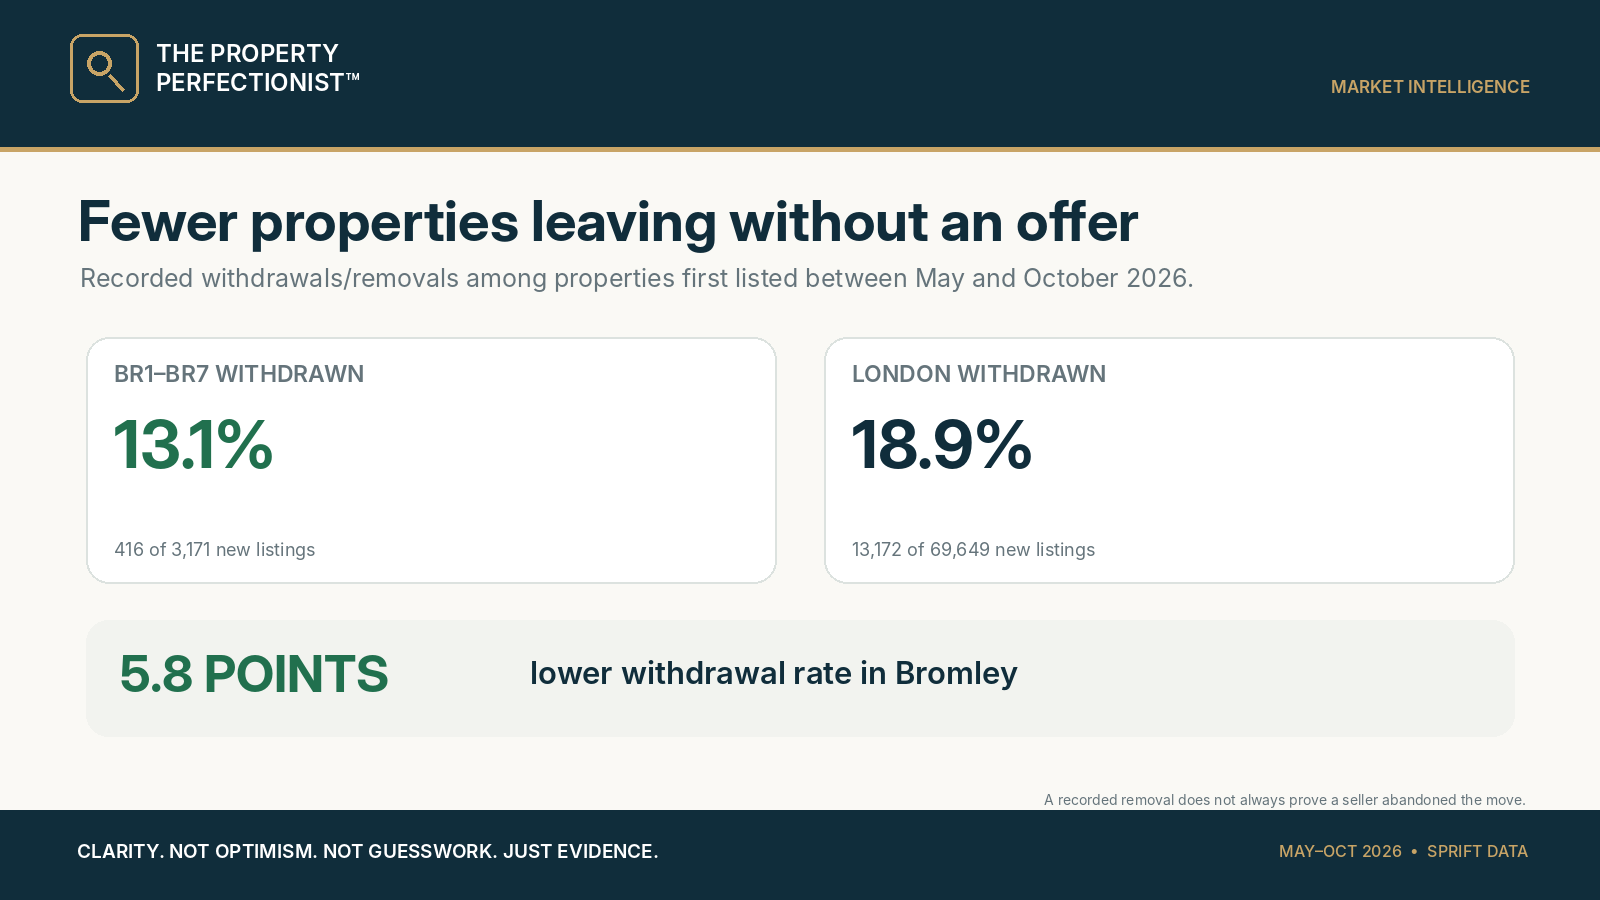
The recorded withdrawal or removal rate was 18.9% of London new listings compared with 13.1% across BR1 to BR7. A removal is not proof that the owner abandoned their sale, since the data does not distinguish every confirmed withdrawal from a listing that disappeared from a portal. Nevertheless, the difference deserves attention.
London flats tell a different story
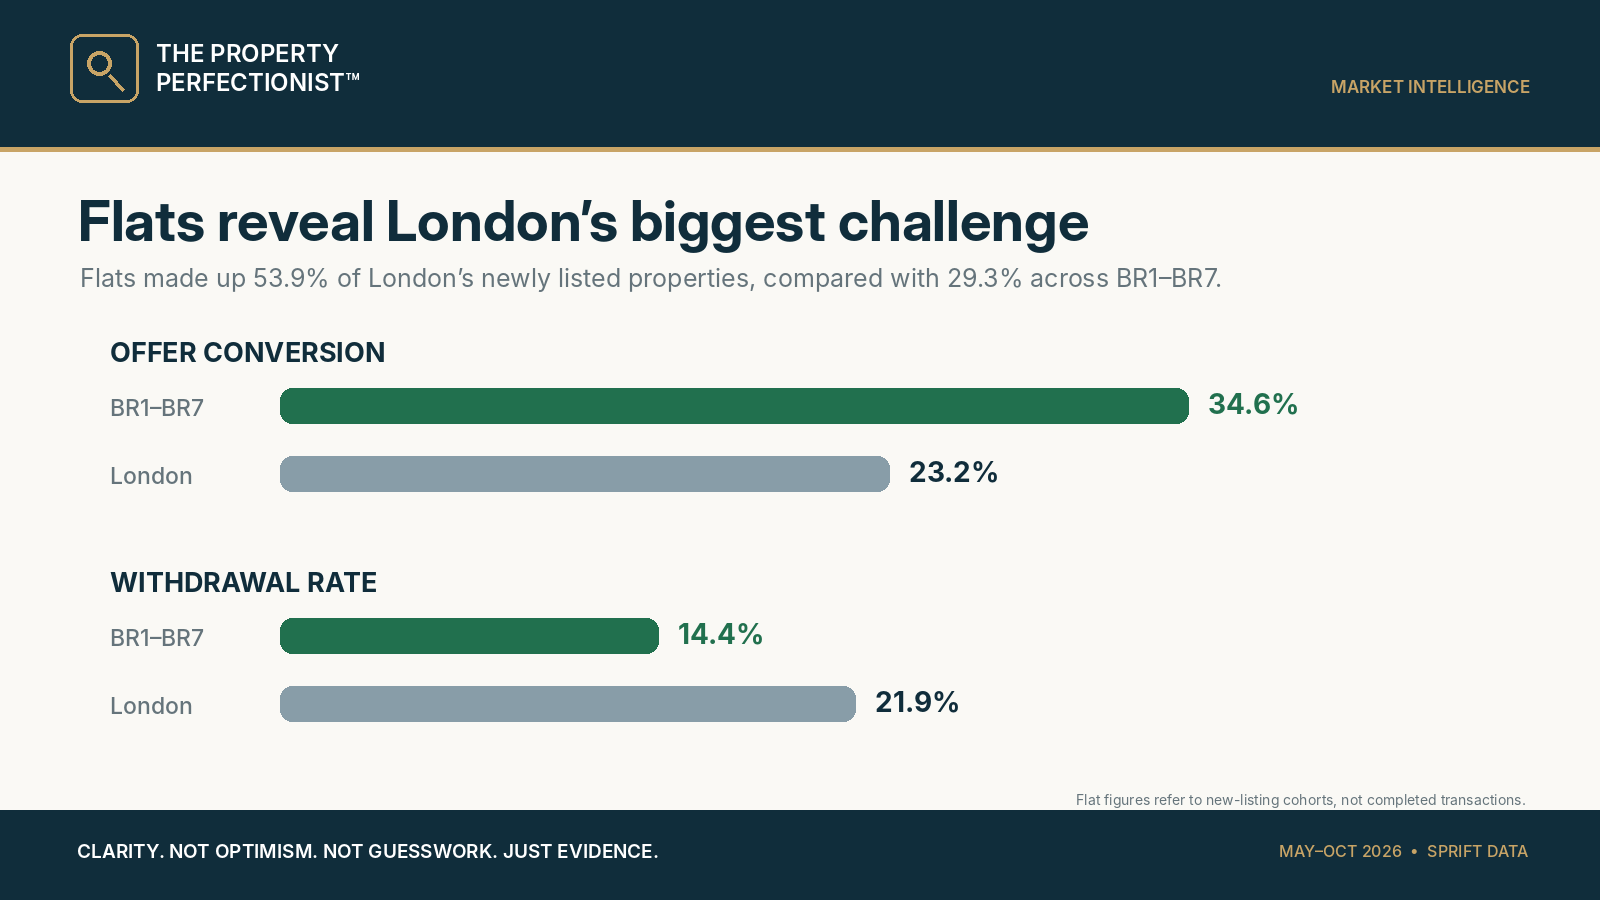
Flats accounted for 53.9% of the London sample, but their offer conversion was just 23.2%. Across BR1 to BR7, flats converted at 34.6%. The recorded withdrawal rates were 21.9% in London and 14.4% in Bromley. This is why comparing one postcode with London as a whole is useful, but never a substitute for comparing genuinely similar homes.
Seven BR postcodes, seven different markets
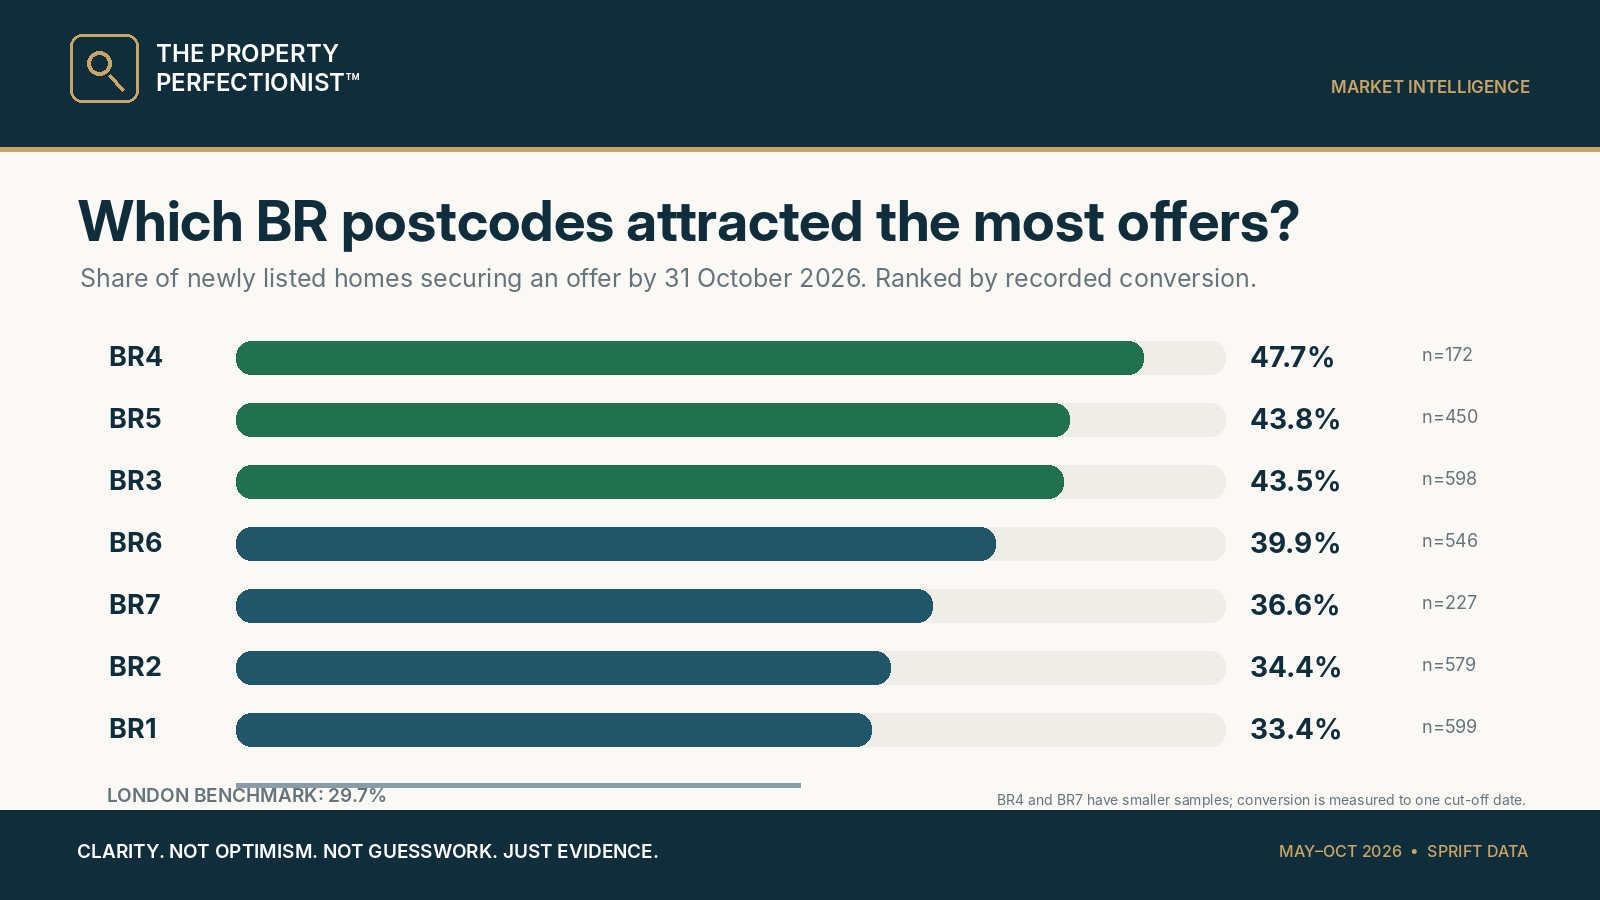
BR4 led on recorded conversion at 47.7%, albeit from only 172 new listings. BR5 and BR3 were both above 43%, while BR1 and BR2 were nearer to the London benchmark. Smaller sample sizes and the differing observation periods of listings mean these figures are market indicators rather than promises of an individual sale.
Price brackets also change buyer behaviour
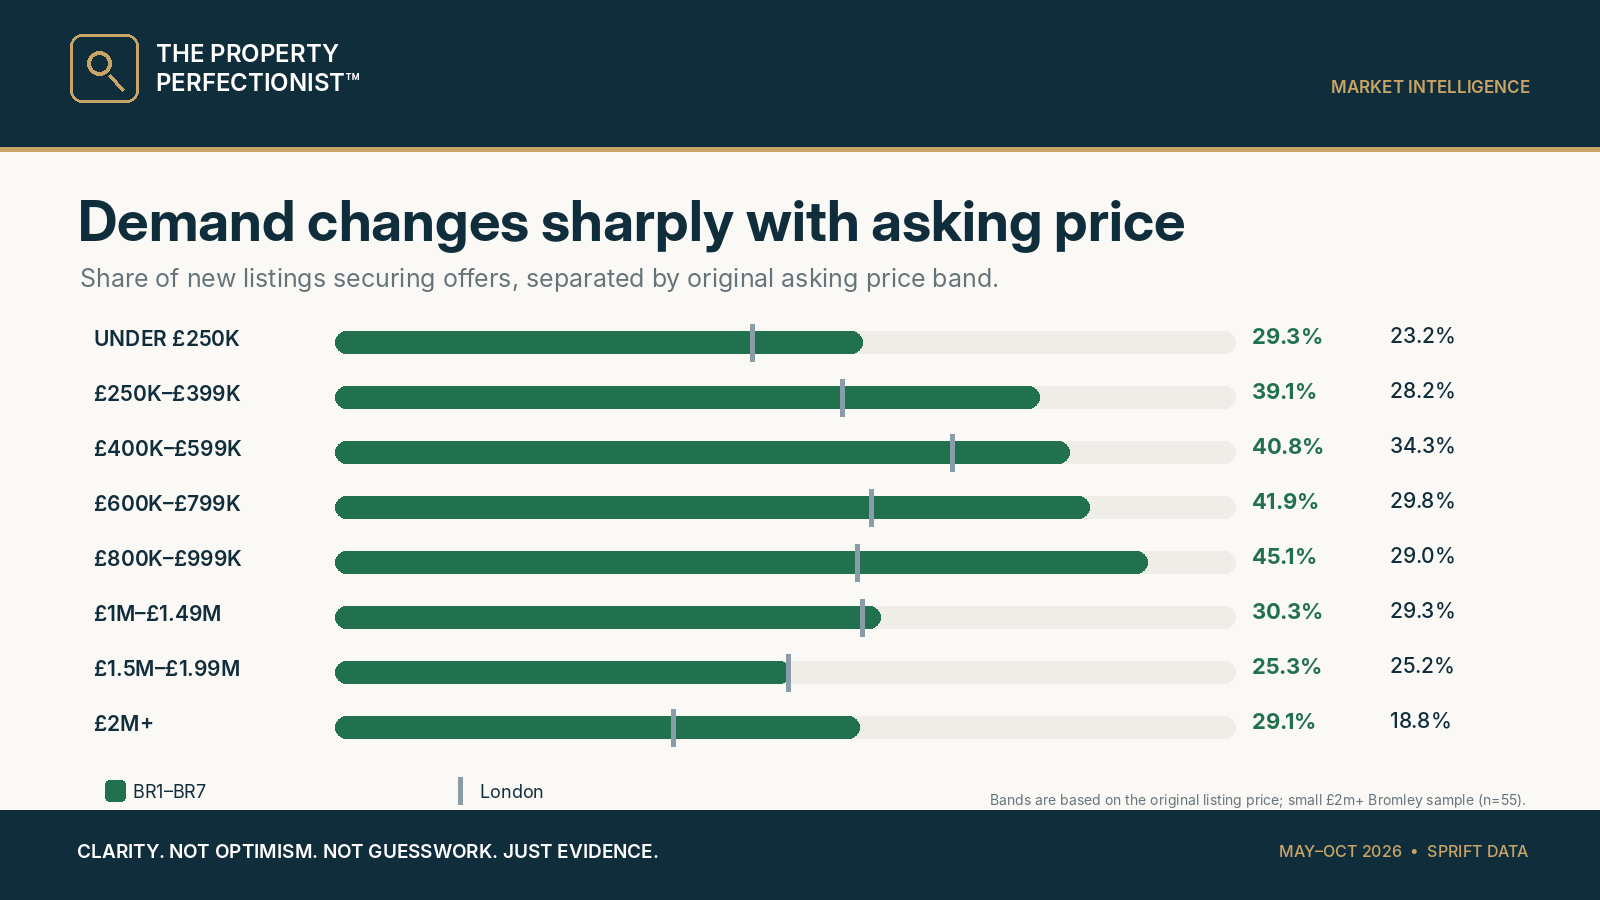
The relative performance of the £400,000 to £1 million bands shows why a single headline for “the property market” is often misleading. Different asking price bands face very different competition and buyer pools.
A stronger market is not an easy market
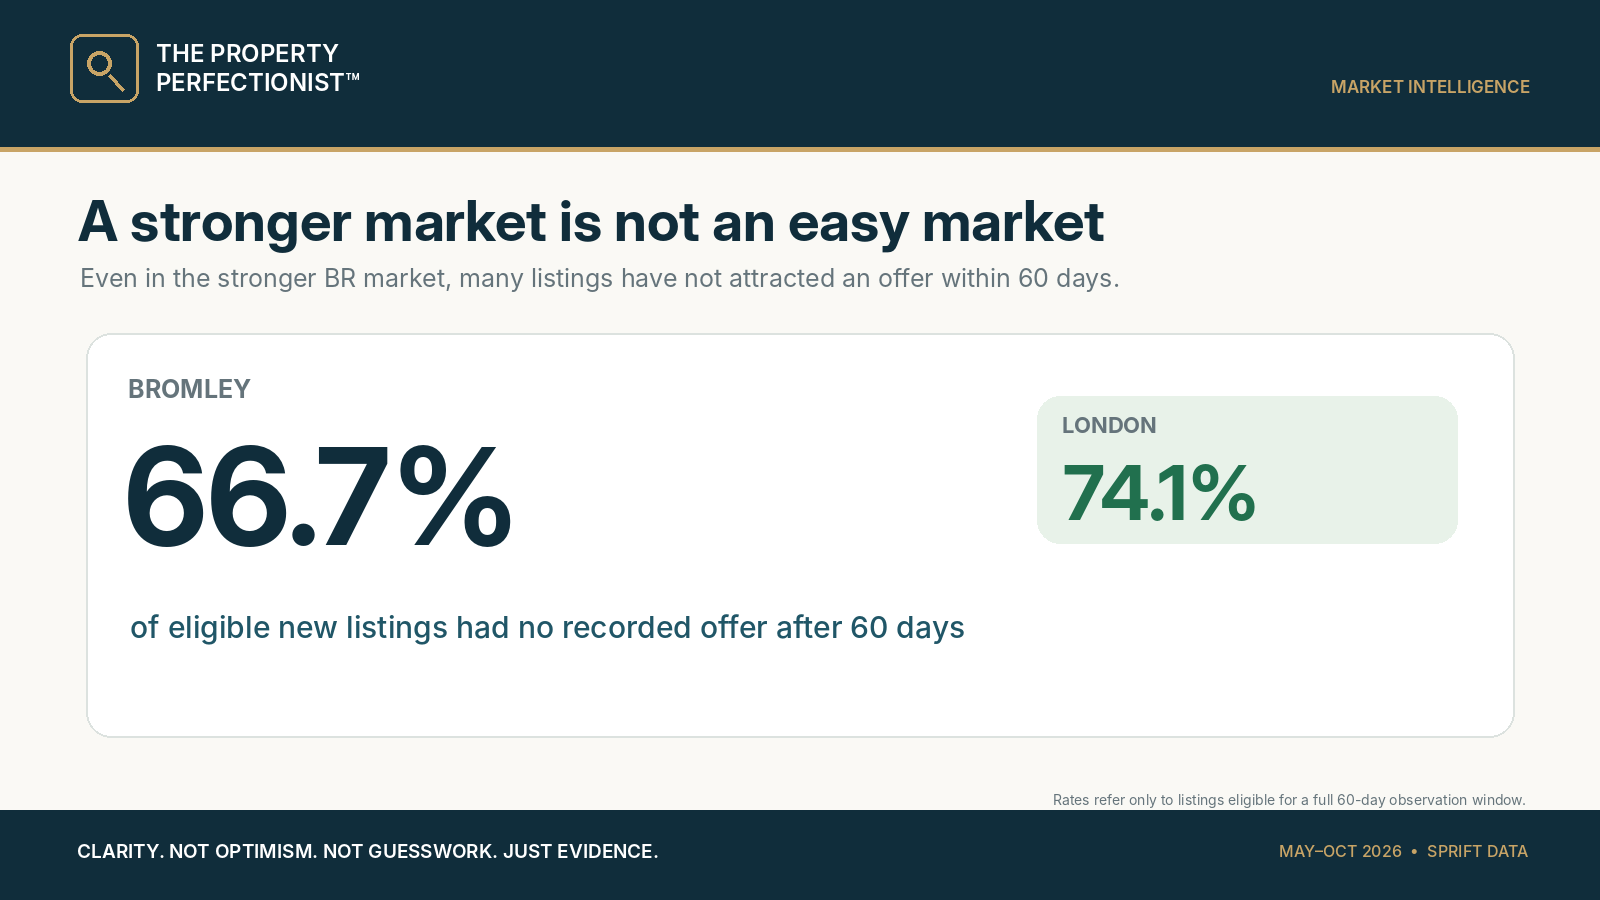
Even here, 66.7% of eligible new BR listings had not secured an offer after 60 days. The most useful question is not whether Bromley is better than London. It is why buyers are choosing some homes over others, and what a seller can do to make theirs the more compelling choice.
What does the market say about your home?
My free Property Perfectionist™ Market Intelligence Report looks at buyer choices, local competing homes and evidence from the market around your property.
James Hall | The Property Perfectionist™
07855 828 736
james.hall@expuk.com
Clarity. Not optimism. Not guesswork. Just evidence.
Research notes: Source: supplied Sprift analysis of recorded residential listings, 1 May to 31 October 2026. London excludes BR postcodes; the comparison covers BR1 to BR7, including small parts outside the London borough of Bromley. Offer conversion is recorded to a 31 October cut off, so recent listing cohorts had less observation time. The fixed window 7, 14, 30 and 60 day measures include only eligible listings. Under offer or SSTC is not a completed sale. Marketing history records may overwrite older relaunches and reductions; some recorded withdrawals may be portal removals. No claims about completed sales or achieved prices are made here.


Leave a Reply