By James Hall, The Property Perfectionist™ | October 2026
Open any property section this autumn and you will see the same refrain. London values are slipping. Buyers are taking their time. Sellers are being told to wait.
After 18 years advising homeowners around Bromley, I treat borough wide averages with caution. What matters is the road you live on, the type of home you own, and how that home is presented when it first hits the market.
So I went back to the records. I looked at Bromley, Beckenham, Chislehurst, West Wickham, Orpington, Petts Wood, Hayes and the other BR districts that make up the local market. I wanted completed prices, listing outcomes and the pace at which buyers actually commit.
What emerged is not a single story of decline. It is a patchwork, and sellers need to know which part they sit in.
Reading the UK House Price Index with local eyes
HM Land Registry’s August figures, out on 21 October 2026, put average London prices 2.2% lower than a year earlier. Bromley on the same release was only down 0.5%.
That gap already hints that national or capital wide headlines can mislead. Still, a borough average blends houses and flats, strong streets and weaker ones.
I therefore ran my own like for like comparison of completed sales from January to June 2026 against the same months in 2025, grouping homes by postcode district, property type and bedroom count. The estimates were:
Houses across Bromley: up 0.2%
Flats across Bromley: down 3.7%
Residential properties overall: down 1.1%
Houses look broadly steady. Flats look softer. These are research estimates rather than a formal index, and they are not a valuation of any single address.
Beckenham held up. Chislehurst did not.
Zoom into two BR districts and the borough average almost disappears.
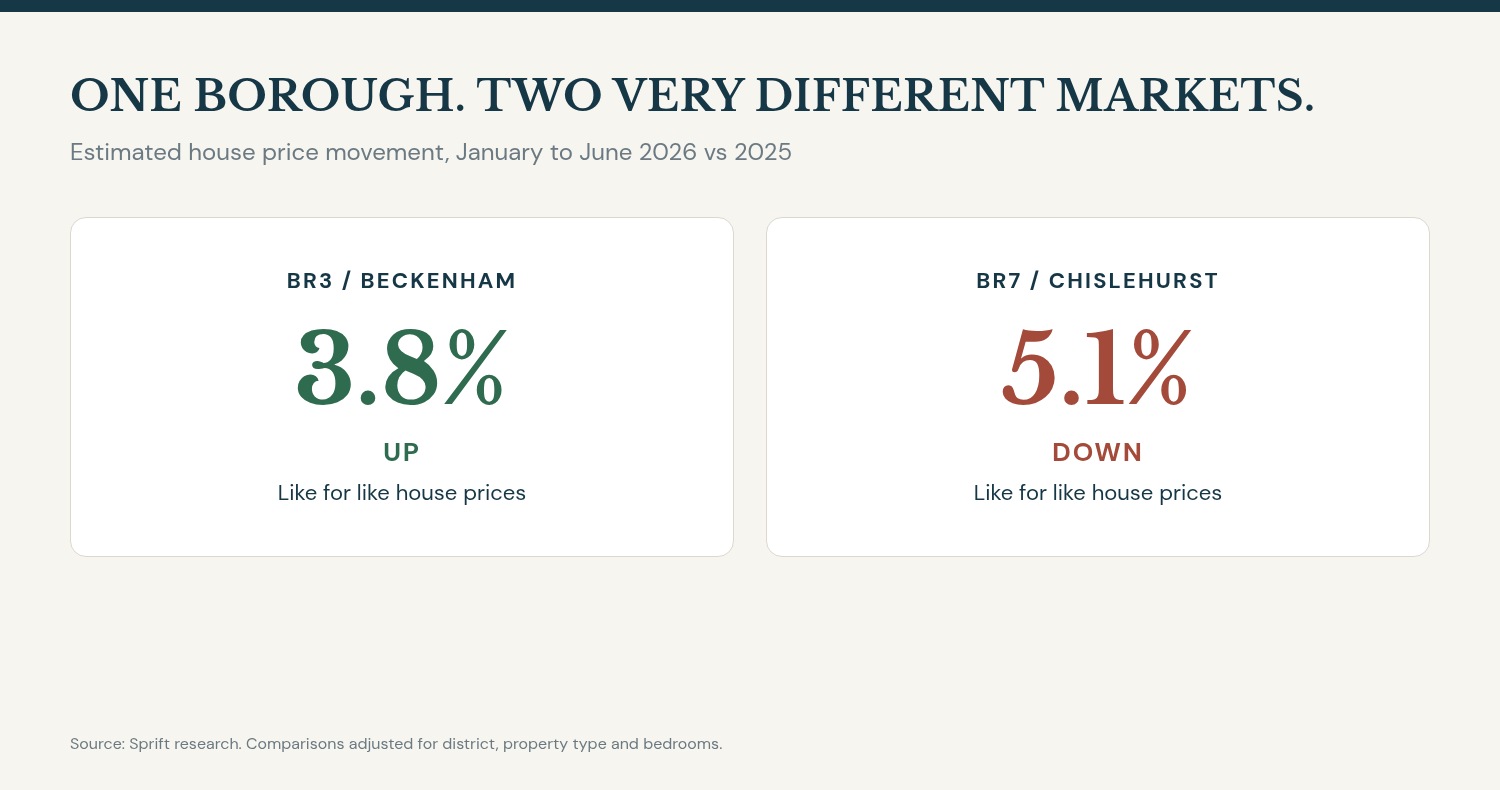
In BR3 (Beckenham), like for like house prices were roughly 3.8% up. In BR7 (Chislehurst), the comparable house figure was about 5.1% down. That is an 8.9 percentage point spread inside one London borough.
The median sale recorded in Chislehurst also slipped from £677,500 down to £607,500 across that January to June period. Part of the drop simply mirrors which homes traded, so I always cross check more than one measure.
None of this means every Beckenham house rose or every Chislehurst house fell. Condition, kerb appeal, size and nearby competition still decide outcomes. It does mean Bromley cannot be treated as one market.
Nearly half of new listings have already been cut
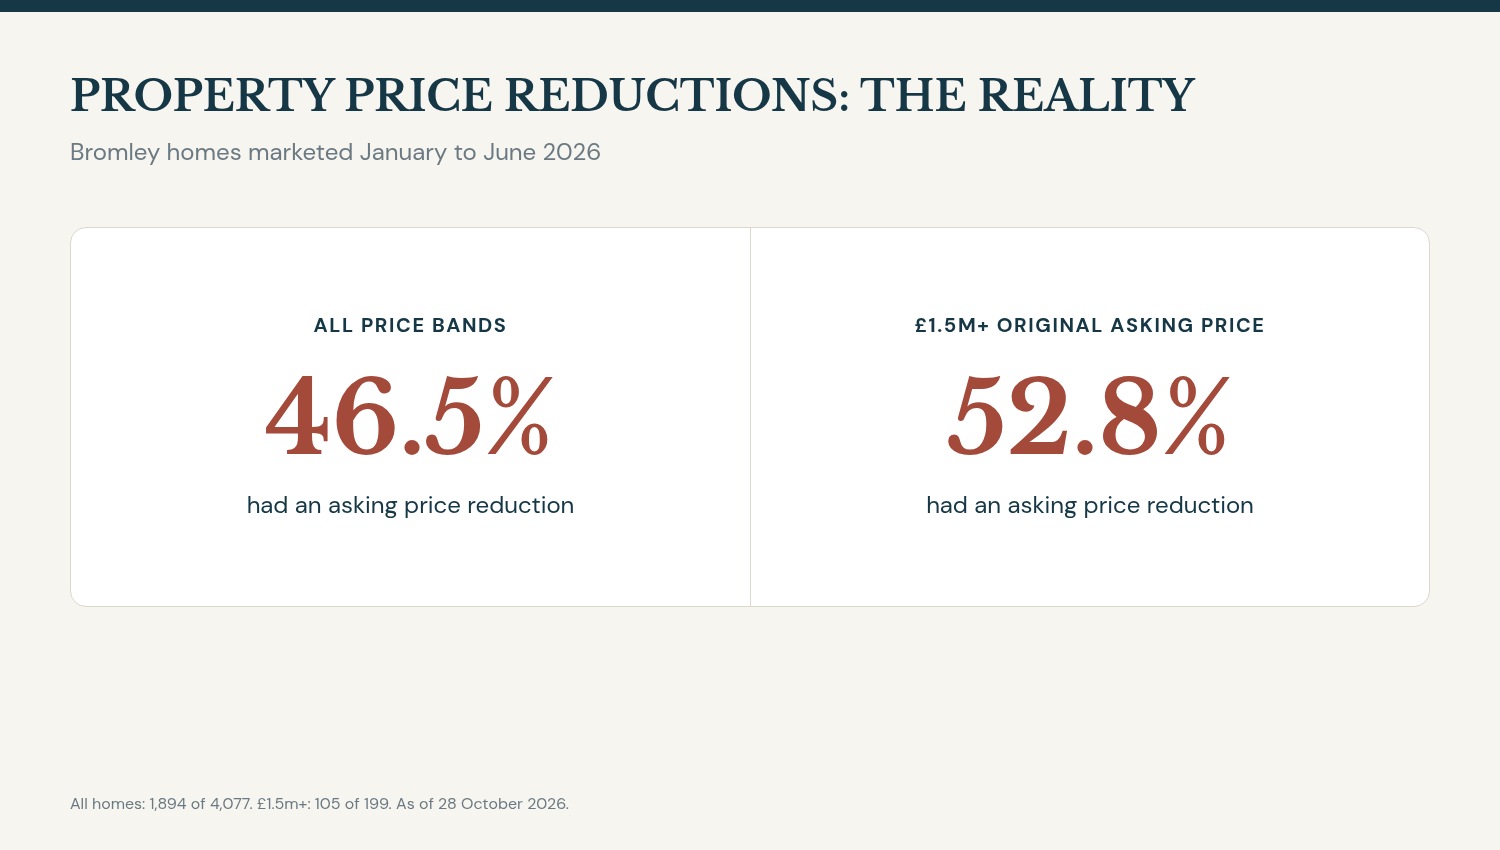
Between January and June 2026, 4,077 homes were recorded as launching onto the Bromley market. By 28 October, 1,894 of them had taken an asking price reduction. That is 46.5%, close to one in two.
A further 810 homes (19.9%) from that cohort were still being marketed at the end of October.
A reduction does not automatically mean the launch price was wrong. Life changes. Priorities shift. Competing stock appears. Even so, the scale of cuts underlines how costly a hopeful first ask can be when buyers can scroll dozens of alternatives in minutes.
Getting the opening position right is no longer optional. It is the strategy.
The Momentum Window™: why the launch fortnight matters twice over
I call the first 28 days after a genuine launch the Momentum Window™. The data from this year’s listings shows why.
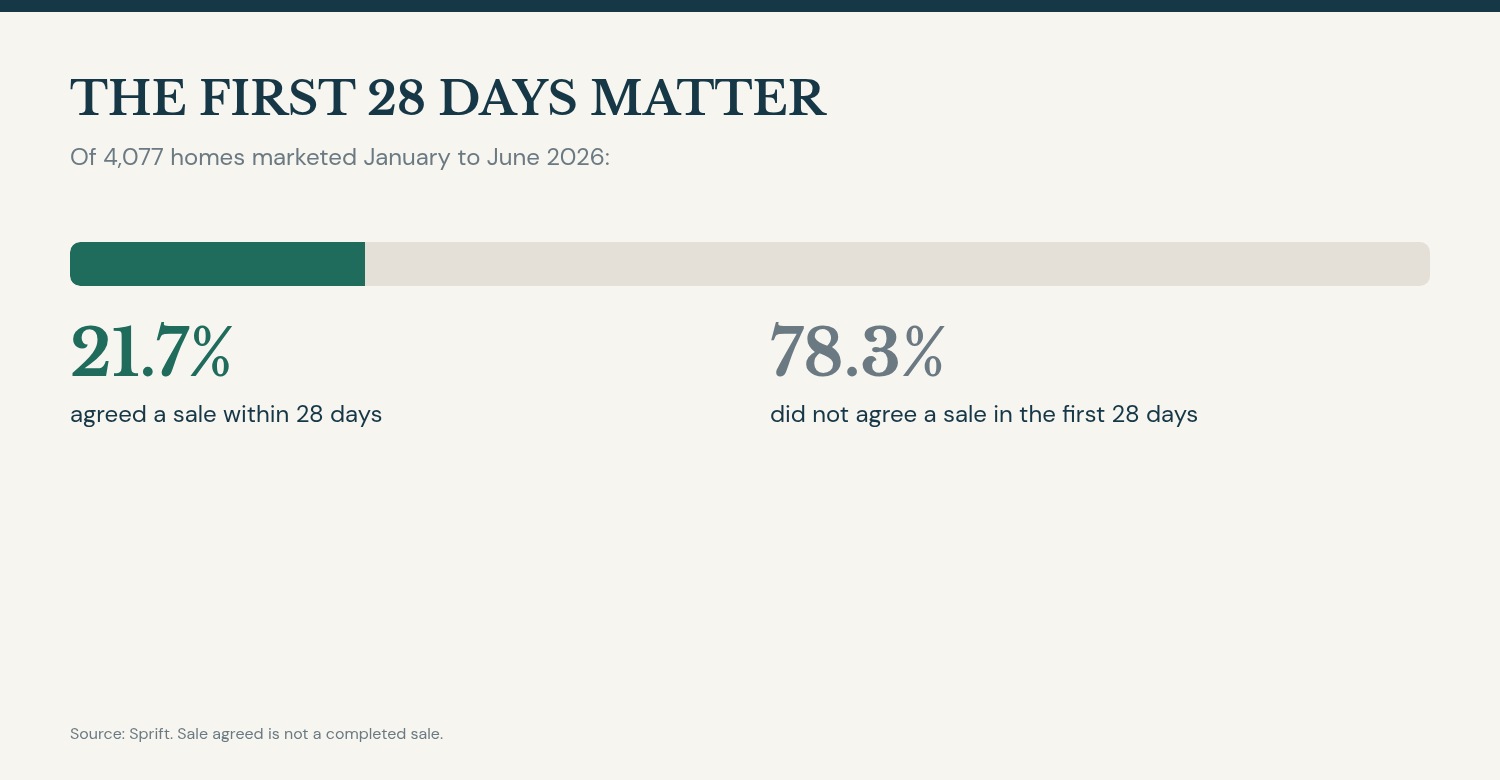
Of those 4,077 homes, only 885 (21.7%) agreed a sale inside that first month. Fewer than one in four.
Among 2026 completions with usable asking price data, homes that agreed within 28 days reached a median 98.9% of the original ask. Homes that took longer reached 96.0%. In the fuller 2025 completed sales sample the gap was 100% versus 95.4%.
That is association, not proof that speed alone creates price. Attractive, sensibly priced homes often sell sooner and closer to ask. It still argues for spending your best thinking, photography and marketing on day one, not month three.
Which BR districts are securing buyers soonest?
Asking prices tell you what sellers hoped for. The share of new listings that agree a sale within 28 days tells you where buyers are actually stepping forward.
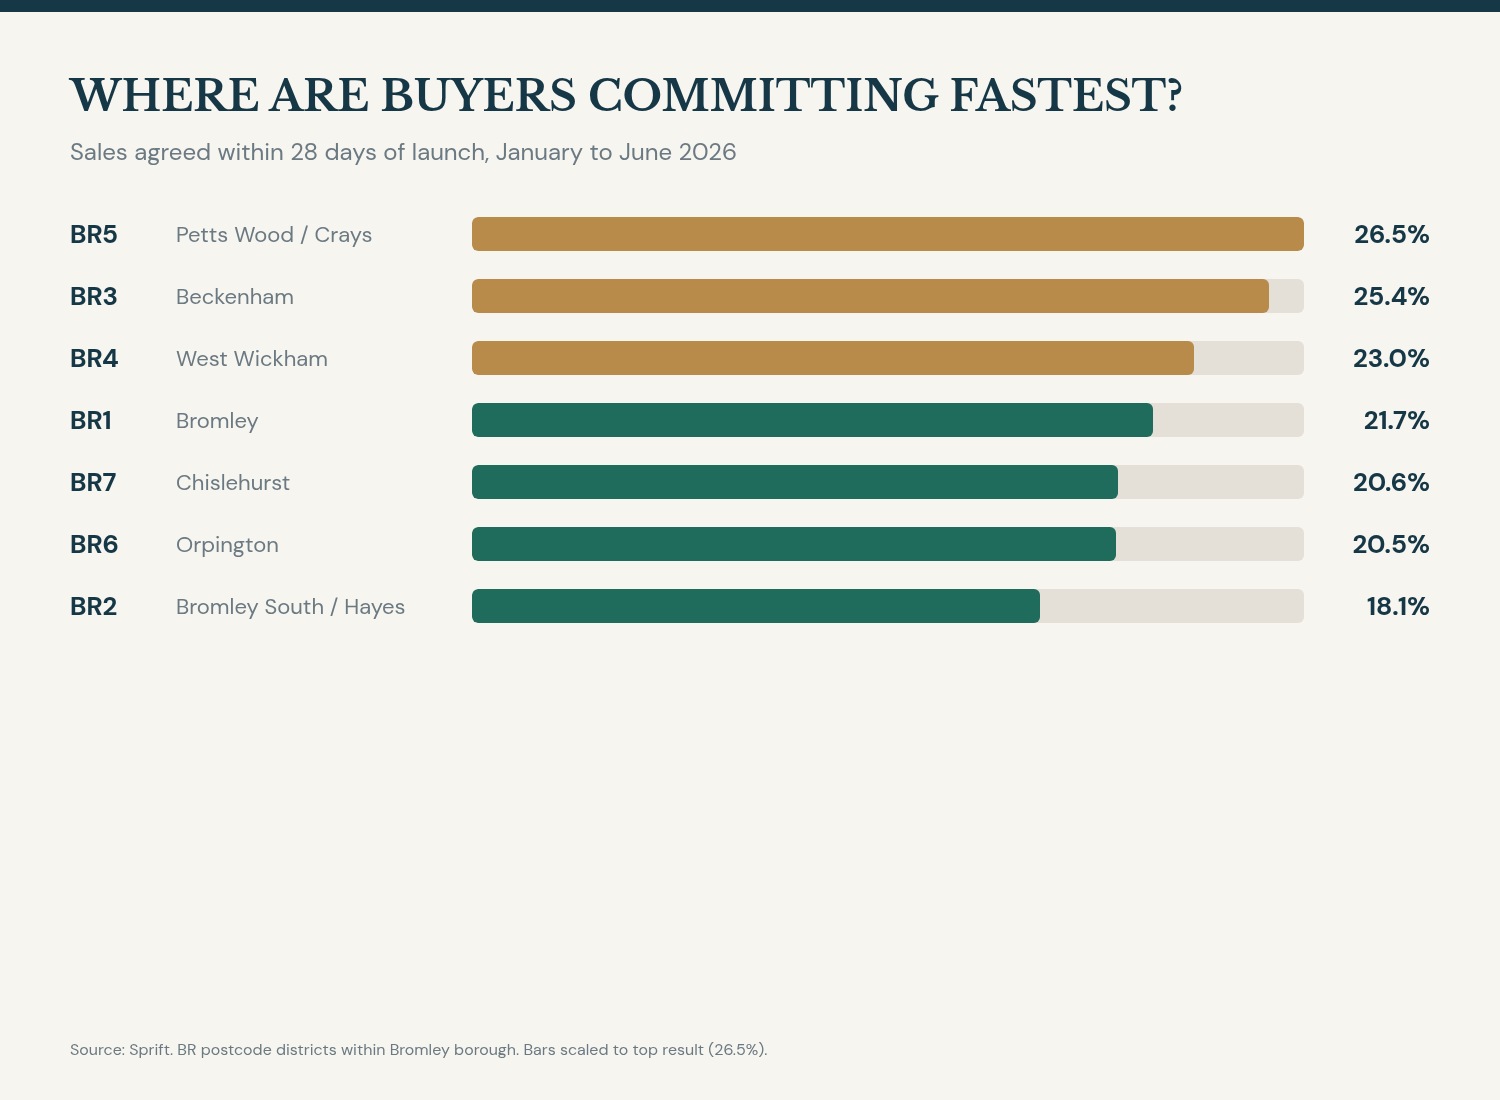
For 2026 launches the 28 day agreement rates were 26.5% in BR5 (Petts Wood and the Crays), 25.4% in BR3 (Beckenham), 23.0% in BR4 (West Wickham), 21.7% in BR1 (Bromley), 20.6% in BR7 (Chislehurst), 20.5% in BR6 (Orpington) and 18.1% in BR2 (Bromley South and Hayes).
Give it 84 days and West Wickham leads the pack: 50.8% of the homes it launched from January to June had a sale agreed by that point, ahead of every other major BR district in the set.
A district can hold values reasonably well and still feel slow for sellers. Speed to agree and price achieved are related, but they are not the same question.
Above £1.5 million the buyer pool thins quickly
At the top of the local market the pattern sharpens. 199 homes launched between January and June 2026 with an original asking price above £1.5 million. By late October, 105 (52.8%) had been reduced and 62 (31.2%) were still available.
Premium buyers are fewer and more selective. Some longer marketing periods are normal. When more than half of this cohort shows a cut, though, it is worth studying every alternative a serious purchaser can choose instead.
Strong photography, a thoughtful lifestyle film, precise digital targeting and a clear story about the property are not luxuries at this level. They are how you interrupt the scroll.
So what should a Bromley seller take from this?
Some local prices are softer. Some are holding. That is the point.
Completed sales suggest Bromley houses broadly held on a like for like basis through the first half of 2026, while flats lagged. Beckenham houses looked more resilient. Chislehurst showed clearer softness.
For most owners the decisive issue is not a borough percentage. It is whether your particular home is priced and presented to win attention when buyers have plenty of choice.
My approach after 18 years is simple. Study real completions. Map the competition. Respect the psychology of the first ask. Launch with marketing that does the property justice from day one. I would rather give a straight reading of the evidence than promise the heavens and deliver the rooftops.
If your home is already live and the viewings have gone quiet, or you are planning a sale and want to start on the right foot, I am happy to sit down with the numbers and talk it through over coffee.
James Hall | The Property Perfectionist™
Independent Property Consultant
07855 828 736
Clarity. Not optimism. Not guesswork. Just evidence.
About this investigation
Those London and Bromley averages come from the Land Registry house price release for August 2026, issued on 21 October 2026.
Everything local comes from my own analysis of property records as at 28 October 2026. I compared completions in January to June 2025 with January to June 2026, and tracked what happened to homes that launched in the first half of 2026 up to the end of October.
Where I quote like for like moves, sales are bucketed by district, property type and bedrooms. That is a research lens, not a repeat sales index and not a valuation of your home. Source marketing histories can be overwritten, and the newest Land Registry completions stay provisional until confirmed.


Leave a Reply