Road Intelligence Report
What are buyers actually doing on Wickham Road — and what might that mean if you’re thinking of selling?
5 Years of Marketing Behaviour. 10 Years of Completed Sales.
James Hall | The Property Perfectionist™
Independent Property Consultant
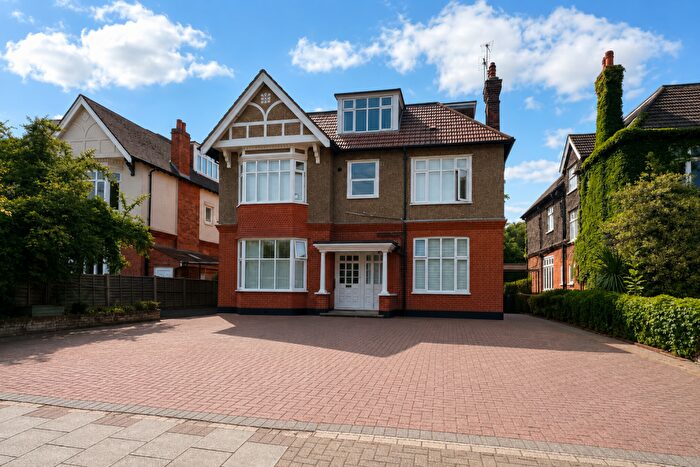
If You Own a House on Wickham Road…
I’ve been investigating your road again.
And this time I’ve gone a step further.
Wickham Road contains a large number of flats and apartments, so simply analysing every residential property on the road risks producing statistics that aren’t particularly useful if you own a house.
So for this report I stripped the data back.
Freehold houses only.
Detached.
Semi-detached.
No flats.
No maisonettes.
No leasehold apartments.
No commercial property.
Because if you’re thinking about selling a house on Wickham Road, the evidence needs to reflect the type of property you actually own.
Let’s look at what I found.
Wickham Road House Record Book
| Road Intelligence | Freehold Houses |
|---|---|
| 🏆 Highest recorded completed sale | £1.515m |
| 🏆 Highest sale in last 5 years | £900,000 |
| 📐 Median £/sq ft — all houses | £520 |
| 🏡 Detached median £/sq ft | £590 |
| 🏠 Semi-detached median £/sq ft | £469 |
| ⚡ Fastest buyer secured | 6 days |
| 🐢 Longest buyer search | 492 days |
| 📉 Of >28-day sellers, subsequently reduced | 66.7% |
| 💷 Average reduction | £47,500 |
| 🏘 Freehold houses on Wickham Road | 35 |
| 🔑 Marketed in last 5 years | 10 — 28.6% |
There is one very important caveat.
The sample is small.
Only 8 clean freehold-house Sold STC campaigns were available over the five-year period.
So I wouldn’t pretend these percentages predict exactly what will happen to the next Wickham Road house.
But they do give us some interesting clues.
Wickham Road Is Mostly Not a House Market
This was one of the first things that caught my attention.
There are approximately:
35 freehold houses
on Wickham Road.
During the last five years, only:
10 individual freehold houses
have appeared for sale.
That’s approximately:
28.6%
So more than seven in ten Wickham Road houses haven’t appeared on the market during that period.
That’s potentially important for a seller.
If you own one of the road’s detached or semi-detached houses, you’re selling something considerably scarcer than the road’s overall residential numbers might suggest.
Scarcity alone doesn’t determine value.
But it can form part of the story.
The Highest Recorded House Sale
The highest completed freehold-house sale I found was:
23 Wickham Road – £1,515,000
Completed in October 2020.
That remains the overall house record in the available data.
The highest completed house sale during the last five years was:
73 Wickham Road – £900,000
completed in October 2024.
The difference between those two numbers demonstrates exactly why I wouldn’t simply take the highest sale on a road and use it as a valuation benchmark.
Every property is different.
Size.
Plot.
Condition.
Architecture.
Position.
Layout.
Specification.
And the market at the time of sale.
A record sale is evidence of what has been possible.
It isn’t automatically evidence of what another house is worth.
What Are Wickham Road Houses Achieving Per Square Foot?
Looking only at completed freehold-house sales from the last five years where usable floor-area information was available, the median was approximately:
£520 per sq ft
But property type matters.
Detached houses recorded a median of approximately:
£590 per sq ft
Semi-detached houses:
£469 per sq ft
Again, the samples are small — five detached transactions and six semi-detached.
So I wouldn’t multiply your floor area by either figure and call that a valuation.
But they are useful reference points.
The five highest house-level £ per sq ft transactions in the period were:
| Property | Approx. £/sq ft |
| 40 Wickham Road | £668 |
| 88 Wickham Road | £623 |
| 44 Wickham Road | £590 |
| 52 Wickham Road | £569 |
| 73 Wickham Road | £523 |
That range tells us something important.
Buyers don’t value every square foot equally.
Condition matters.
Layout matters.
Plot matters.
Presentation matters.
And larger houses can often achieve a lower rate per square foot even while selling for more money overall.
That’s why I treat £ per square foot as a clue.
Not a formula.
How Quickly Have Wickham Road Houses Found Buyers?
There were 8 clean freehold-house campaigns in the five-year sample.
Two secured a buyer within 28 days.
The fastest was:
8 Wickham Road – 6 days
73 Wickham Road also secured a buyer quickly:
8 days
Both did so without reducing.
At the opposite end of the spectrum:
32 Wickham Road – 492 days
That’s more than sixteen months.
Same road.
Same broad property category.
Very different buyer response.
So I wanted to know what happened once properties moved beyond the initial launch period.
The 28-Day Clue
Of the 8 qualifying house campaigns:
2 secured a buyer within 28 days.
That left:
6 houses
taking longer than four weeks.
Of those six:
4 subsequently reduced their asking price.
That’s:
66.7%
Now, with only six properties in that group, I would not present 66.7% as some universal law.
But I would pay attention to it.
Because the pattern is consistent with something I see repeatedly in property marketing.
The longer a property remains available without attracting the right buyer, the greater the chance the seller eventually changes something.
Very often, that something is price.
This is why I place so much emphasis on what I call the:
Momentum Window™
The opening period when the property is new, buyer attention is at its strongest and you have the greatest opportunity to create urgency.
19.5 Days vs 133 Days
There is another striking difference in this small sample.
The four houses that did not reduce took a median of:
19.5 days
to secure a buyer.
The four that eventually did reduce took a median of:
133 days
That’s almost seven times longer.
It would be wrong to say the price reduction caused the longer marketing time.
The more sensible interpretation is that the properties experiencing weaker buyer response stayed available longer and were therefore more likely to require a later change.
But from a seller’s perspective, the difference in the journey is significant.
19.5 days versus 133 days.
That is why I believe so much of the work should happen before the property goes live.
How Much Did Sellers Reduce By?
Among the four qualifying reduced houses:
Average reduction:
£47,500
Median reduction:
£37,500
Average percentage reduction:
5.25%
Median percentage reduction:
4.17%
The largest recorded reduction belonged to:
26 Wickham Road
Original asking price:
£950,000
Later asking price:
£850,000
Difference:
£100,000
or approximately:
10.5%
The property eventually secured a buyer after 203 days.
A £100,000 adjustment is substantial.
And it raises the question I’d want to ask before launching:
Could better initial positioning have protected both time and perception?
What Happens After a Reduction?
For the houses that reduced, the median seller waited:
79 days
from launch before making the first recorded price change.
After that reduction, the median time before securing a buyer was:
another 55 days
Again, this is based on only four properties.
But the pattern is worth understanding.
A reduction doesn’t necessarily create an immediate buyer.
And that’s one of the reasons I’m cautious about the phrase:
“Let’s try this price first. We can always reduce later.”
You absolutely can.
But later isn’t the same as launch day.
At launch, the property is fresh.
Portal alerts are triggered.
Existing buyers see it for the first time.
Social campaigns begin.
Agents start discussing it.
New photography catches attention.
The opportunity feels new.
A price reduction can help reposition a property.
But:
A reduction changes the asking price.
It doesn’t fully recreate the original launch.
What Does the Time Breakdown Show?
The eight clean house campaigns break down like this:
| Time to Buyer | Houses | Reduced |
| 0–28 days | 2 | 0 |
| 29–60 days | 2 | 1 |
| 61–90 days | 1 | 1 |
| 91+ days | 3 | 2 |
I deliberately wouldn’t turn those into a dramatic percentage chart.
One of the groups contains just a single property.
That would make a “100% reduction rate” look much more statistically significant than it really is.
This is where good property analysis matters.
Evidence should inform the story — not be manipulated to create one.
So What Would I Want to Know If I Owned a House Here?
If I were considering selling a Wickham Road house, these are the numbers I’d remember:
35
The approximate number of freehold houses on the road.
10
The number appearing for sale during the last five years.
£1.515m
The highest completed house sale currently recorded.
£520/sq ft
The five-year median across usable freehold-house transactions.
£590/sq ft
The detached median.
£469/sq ft
The semi-detached median.
6 days
The fastest recent buyer secured.
66.7%
Four of the six slower-than-28-day campaigns subsequently reduced.
19.5 vs 133 days
The median buyer-securement times for non-reduced versus reduced houses.
£47,500
The average reduction among the reduced sample.
79 days
The median wait before reducing.
55 more days
The median time from reduction to finally securing a buyer.
No single one of those figures tells me what your house is worth.
But together they begin to tell us something about buyer behaviour.
What the Evidence Appears to Be Saying
Wickham Road’s freehold houses are relatively scarce.
Only a small number have appeared on the market during the last five years.
And the recent campaign evidence suggests that some houses have secured buyers extremely quickly, while others have remained available for considerably longer.
The slower campaigns were also considerably more likely to eventually change price.
That doesn’t prove pricing was the only issue.
It rarely is.
Presentation.
Condition.
Photography.
Competition.
Layout.
Market timing.
Buyer perception.
And asking price can all contribute.
But it reinforces why I don’t believe a launch should simply be:
“Put it on and see what happens.”
The early response is evidence.
The market starts talking almost immediately.
The job is to understand what it is saying.
The Property Perfectionist’s View
If I were preparing a Wickham Road house for market, I wouldn’t start with the road average.
I’d identify the houses buyers would genuinely compare against yours.
Then I’d ask:
How does your size compare?
Your plot?
Your condition?
Your specification?
Your presentation?
What else can the same buyer purchase nearby?
Which Rightmove price brackets should we appear within?
And what can we do before launch to make the property feel compelling from day one?
Because everything I recommend is designed to maximise your:
Momentum Window™
Price to attract attention.
Present to justify the price.
Market to create desire.
Launch with purpose.
Thinking of Moving From Wickham Road?
If you own a freehold house on Wickham Road and you’re considering selling, I can prepare an individual Property Perfectionist™ Market Intelligence Review for your home.
Rather than simply applying a road average, I’ll investigate the evidence relevant to your particular property.
That can include:
your property’s history, house-specific comparable evidence, current competing properties, £ per square foot, buyer search brackets, likely buyer psychology, presentation opportunities and how I would structure the launch.
Because your home isn’t an average.
Buyers decide value.
Buyers compare.
My role is to understand that comparison before your property enters it.
James Hall
The Property Perfectionist™
Independent Property Consultant
07855 828 736
Every road leaves clues.
Clarity. Not optimism. Not guesswork. Just evidence.
Methodology & Important Limitations
This analysis has deliberately been restricted to freehold houses only on Wickham Road: detached and semi-detached properties classified as residential houses with no lease record. Flats, maisonettes, apartments, leasehold units, whole-block records and commercial premises are excluded.
There are approximately 35 freehold houses identified on Wickham Road. Ten appeared for sale during the last five years, with eight producing clean listing-to-Sold-STC campaigns suitable for the marketing analysis.
One freehold-house record was excluded from the clean campaign sample because its recorded Sold STC date pre-dated the relevant current listing date.
The marketing sample is very small. All percentages and median figures should therefore be treated as indicative observations rather than statistically robust forecasts.
Completed-sale evidence uses available Land Registry transaction records.
£ per square foot calculations combine historic completed-sale prices with available current EPC floor areas. Where a property has subsequently been extended or materially altered, the current floor area may not represent its size at the historic sale date.
No qualifying terraced-house evidence was available in the dataset.
This report represents an independent professional interpretation of publicly available and third-party market evidence. It is not an RICS Red Book valuation and should not be relied upon for formal valuation, mortgage lending, taxation or legal purposes.


Leave a comment