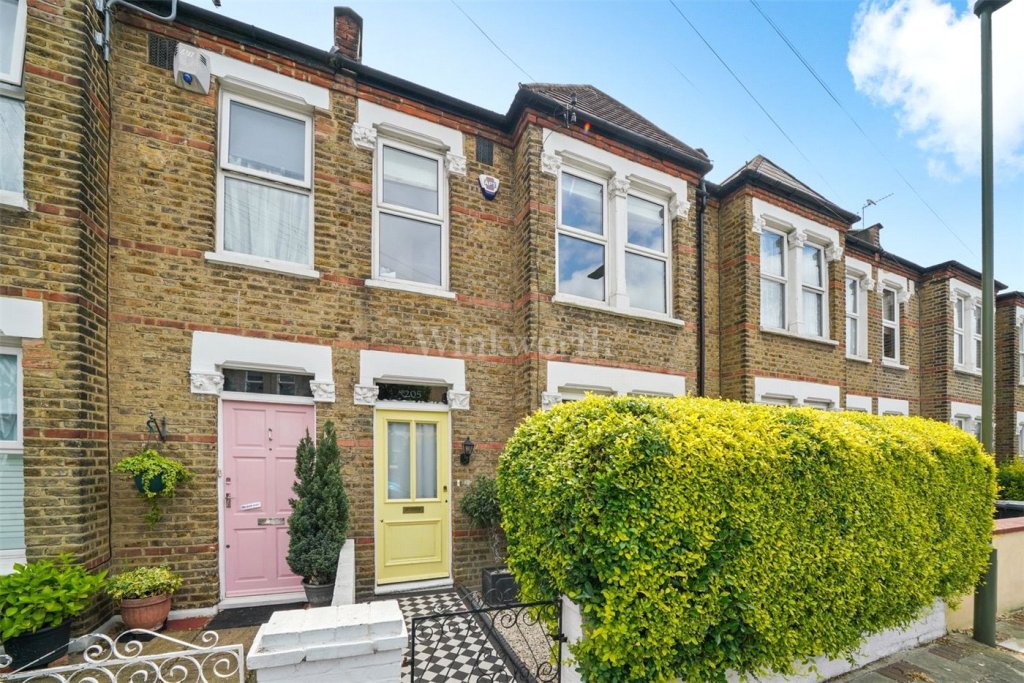
Why I’ve Prepared this Report
If you own a property on Blandford Road, you’ve probably got a rough idea of what you think it’s worth.
You may have seen neighbouring properties sell.
You may have looked at online estimates.
You may even remember what houses were achieving five or ten years ago.
But I wanted to look at something different.
The evidence.
So I’ve analysed recorded Land Registry transactions across Blandford Road and compared them with the wider BR3 housing market.
I was looking for two things in particular:
How have achieved prices changed?
And perhaps just as importantly:
How often are buyers actually choosing to buy here?
Because price is only one measure of a property market.
Liquidity matters too.
And Blandford Road produced some interesting results.
Let’s look at the evidence.
Blandford Road at a Glance
Based on recorded house transactions within the dataset:
| Blandford Road | |
|---|---|
| Recorded house sales | 105 |
| Period analysed | 2016–2026 |
| Average transactions | 10+ per year |
| 2016–2020 median sale price | £447,500 |
| 2021–2026 median sale price | £573,500 |
| Increase between periods | £126,000 |
| Percentage difference | +28.2% |
| Highest recorded house sale | £825,000 |
| Terraced transactions | 81 |
| Semi-detached transactions | 23 |
Immediately, two things stand out.
Prices have moved.
But buyers have also continued to transact in significant numbers.
This was the number that initially caught my attention.
There are 105 recorded house transactions on Blandford Road in the dataset over approximately ten years.
The First Clue
105 House Sales
That’s an average of more than 10 house sales every year.
More importantly, when I compared that with other roads across the BR3 dataset, Blandford Road came out on top for recorded house transactions.
The Most Active BR3 Roads
| Road | Recorded House Sales |
| Blandford Road | 105 |
| Upper Elmers End Road | 96 |
| Eden Park Avenue | 95 |
| Clock House Road | 87 |
| Mackenzie Road | 75 |
| Birkbeck Road | 69 |
| Ravenscroft Road | 63 |
| Eden Way | 62 |
| Aylesford Avenue | 60 |
| Village Way | 57 |
Why does that matter?
Because homeowners naturally concentrate on price.
But liquidity is another important measure of a road’s property market.
A high-value road where properties very rarely transact gives us relatively little evidence.
Blandford Road is different.
There is a substantial history of buyers making decisions here.
Buyers keep choosing Blandford Road.
And that gives us considerably more evidence to investigate.
The Second Clue
Prices Have Moved too
Next, I divided the evidence into two periods.
2016–2020
45 house sales
Median achieved price:
£447,500
Then I looked at transactions from 2021 onwards.
2021–2026
60 house sales
Median achieved price:
£573,500
That’s a difference of:
+£126,000
or approximately:
+28.2%
That’s significant.
But it needs to be interpreted carefully.
It doesn’t mean every house on Blandford Road has increased in value by 28.2%.
No responsible property analysis should make that assumption.
Different properties have sold during each period.
Some will have been extended.
Some refurbished.
Some may have added loft conversions, better kitchens, bathrooms or landscaping.
Others may have required substantial modernisation.
Property values aren’t created by spreadsheets. Buyers decide value.
But when we have 105 separate house transactions, the movement in the median provides a useful indication of how the market on the road has changed.
What Happened Year by Year
The annual figures reveal another interesting story.
| Year | House Sales | Median Sale Price |
| 2016 | 4 | £435,075 |
| 2017 | 14 | £446,000 |
| 2018 | 11 | £457,000 |
| 2019 | 5 | £447,500 |
| 2020 | 11 | £485,000 |
| 2021 | 14 | £527,500 |
| 2022 | 8 | £622,500 |
| 2023 | 12 | £562,500 |
| 2024 | 16 | £557,500 |
| 2025 | 8 | £650,000 |
| 2026* | 2 | £632,500 |
*2026 is incomplete within the supplied Land Registry dataset and should not be treated as a full-year comparison.
This is exactly why I prefer evidence to headlines.
Prices haven’t moved upwards in a perfectly straight line.
Property markets rarely do.
The mix of houses selling each year changes, as do mortgage rates, buyer confidence, supply and the condition of the individual properties coming to market.
But step back from individual years and the longer-term shift becomes clearer.
The median for the more recent period is materially above the earlier one.
Not Every House on Blandford Road is the Same
This matters.
Of the 105 house transactions:
81 were terraced
23 were semi-detached
1 was detached
So I separated the two main house types.
Terraced Houses
2016–2020 median:
£440,000
2021–2026 median:
£559,500
Difference:
+£119,500 | +27.2%
Semi detached Houses
2016–2020 median:
£515,000
2021–2026 median:
£640,000
Difference:
+£125,000 | +24.3%
That is particularly interesting.
Because the increase isn’t simply being created by one category of property.
Both of Blandford Road’s principal house types show materially higher median achieved prices in the more recent period.
Another Clue: Where are Buyers Spending Money?
Looking at all 105 recorded house transactions:
| Achieved Price | Number of Sales |
| Under £400,000 | 11 |
| £400,000–£499,999 | 33 |
| £500,000–£599,999 | 36 |
| £600,000–£699,999 | 18 |
| £700,000+ | 7 |
This helps illustrate the breadth of the Blandford Road market.
It isn’t one single price point.
Buyers are making comparisons based on the particular house in front of them.
And that’s important if you’re thinking about selling.
Because your competition isn’t necessarily simply:
“Another house on Blandford Road.”
It’s whatever else a buyer can purchase for similar money.
Blandford Road V’s BR3
This is where the evidence becomes particularly interesting.
Across the wider BR3 house dataset:
BR3 – 2016–2020
Median achieved price:
£595,000
BR3 – 2021–2026
Median achieved price:
£700,000
That’s an increase of approximately:
17.6%
Compare that with Blandford Road:
Blandford Road
£447,500 → £573,500
+28.2%
Again, I would be careful about describing that as Blandford Road having definitively “outperformed” BR3.
The composition of the two datasets is different.
BR3 contains everything from smaller terraced houses to substantially larger detached homes.
But the comparison does give us another clue.
The shift in Blandford Road’s median achieved house price between these two periods has been greater than the equivalent shift across BR3 as a whole.
That’s worth knowing.
WHAT BUYERS MAY BE THINKING
Property owners tend to think about their home individually.
Buyers don’t.
Buyers compare.
They might compare your house with another house further along Blandford Road.
But they’ll also compare it with properties on surrounding roads.
They’ll compare:
Price.
Size.
Condition.
Extensions.
Kitchen and bathrooms.
Outside space.
Parking.
Presentation.
And increasingly, they’ll compare the cost and inconvenience of what they’ll need to change after moving in.
A beautifully presented £650,000 house can therefore feel better value than a £600,000 house requiring substantial work.
That’s why two apparently similar houses can produce very different reactions from the market.
The PropertyPerfectionist View
So what does the evidence appear to be telling us?
Firstly:
Blandford Road has liquidity.
105 recorded house transactions make it the most actively traded road for houses within this BR3 dataset.
Secondly:
Median achieved prices have moved materially.
From £447,500 during 2016–2020 to £573,500 from 2021 onwards.
Thirdly:
The movement appears across the main house types.
Terraced and semi-detached properties both show materially higher median achieved prices in the more recent period.
And finally:
Blandford Road’s market is not one price.
Individual outcomes still depend heavily on the property itself.
That’s where data can only take us so far.
THREE QUESTIONS WORTH ASKING
If you own a house on Blandford Road, I’d be asking:
1. What are buyers actually comparing my home with today?
Not what sold three years ago.
What’s competing for their attention now?
2. Where does my property sit within the Blandford Road evidence?
Terrace or semi?
Extended or original?
Refurbished or requiring work?
Those differences matter.
3. If I were selling, how would I maximise the opportunity?
Because knowing approximately what your property might be worth is only part of the equation.
How you launch it matters too.
The photography.
The presentation.
The story.
The marketing.
The pricing strategy.
And the first impression you create when buyers initially discover it.
If You are Thinking of Selling
Check the Data
This report deliberately isn’t a valuation.
I haven’t inspected your house.
I don’t know what’s been changed.
I don’t know its condition.
And I don’t know what makes your particular property different.
That’s the missing evidence.
What I can do is combine what we already know about Blandford Road with an inspection of your home, current competing properties and today’s buyer behaviour.
Then we can answer the question that actually matters:
What does all of this evidence mean for your property?
If you’re considering selling, whether that’s now, in six months, or you’re simply curious, I’d be very happy to prepare an individual evidence-based review.
No generic valuation.
No inflated number designed to win an instruction.
Just a conversation about the evidence.
James Hall
THE PROPERTY PERFECTIONIST™
Every road leaves clues.
Clarity. Not optimism. Not guesswork. Just evidence.
IMPORTANT INFORMATION
This Road Intelligence Dossier is an independent analysis based primarily on publicly available HM Land Registry transaction data contained within the dataset analysed. Land Registry information records completed transactions and does not reveal the condition, specification, size, extensions, refurbishment or individual circumstances surrounding every sale.
Median-price comparisons should therefore be treated as indicators of market activity rather than evidence that every individual property has changed in value by the same percentage.
The 2026 data is incomplete and may also be affected by the normal delay between completion and registration of transactions.
This report represents an independent professional opinion and market analysis. It is not an RICS Red Book valuation and should not be relied upon for formal valuation, mortgage, taxation or legal purposes. A reliable assessment of an individual property requires an inspection together with detailed analysis of relevant comparable evidence and current market competition.


Leave a comment