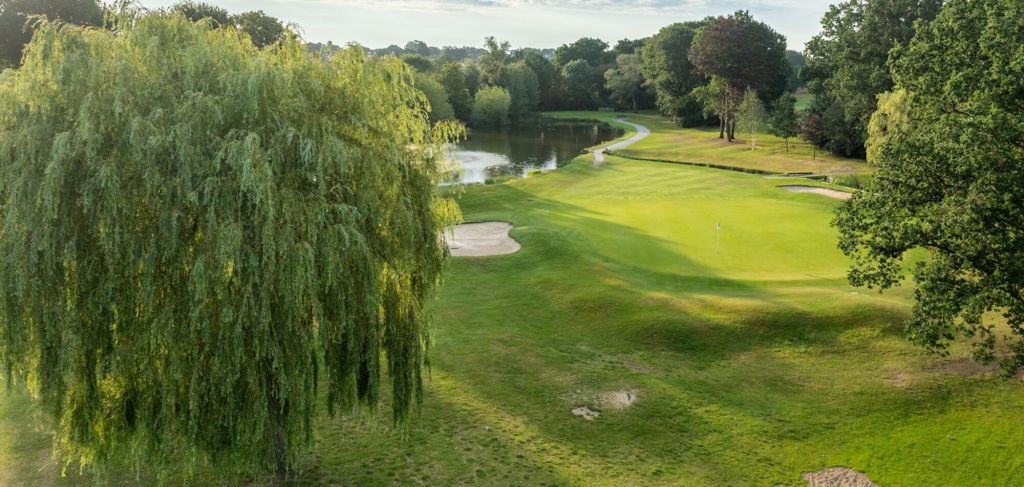
Park Langley has long had a reputation as one of Beckenham’s most desirable residential areas.
Wide, leafy roads. Generous plots. Substantial family homes. A distinctive garden-suburb character. Langley Park Golf Club. And access to both Langley Park School for Boys and Langley Park School for Girls.
But reputation is one thing.
What does the evidence actually say?
I recently analysed 1,066 properties across 16 Park Langley roads, using Land Registry completed-sale history alongside detailed property information and a smaller sample of current and recent marketing data.
There are 1,167 completed transactions in the study, dating back to 1995.
But I wasn’t particularly interested in producing another article about the “average Park Langley house price”.
I wanted to understand how this market actually behaves.
Which roads see the most movement?
How much does the size of a house affect its value?
Where does most of the market really sit?
How reliable is £ per square foot?
And what happens when a property doesn’t attract its buyer early?
Some of the answers were predictable.
Others weren’t.
Let’s look at the evidence.
Park Langley is a remarkably tightly held market
This was one of the first things that caught my attention.
Of the 1,066 homes analysed, around 798 appear not to have changed hands for at least 10 years.
And roughly 541 appear not to have sold for at least 20 years.
That’s more than half of the properties in the study.
But the picture isn’t the same on every road.
Some parts of Park Langley see noticeably more movement than others.
Whitecroft Way, for example, had one of the highest recent turnover rates in the dataset.
At the other end, roads including Malmains Way and Barnfield Wood Road were among the most tightly held.
And there is an interesting contradiction here.
Malmains Way produced the highest recent individual sale in the entire study — £2.495 million.
Yet it is also one of the roads where properties change hands relatively infrequently.
In other words:
Prestige and liquidity are not the same thing.
Some of Park Langley’s most valuable homes are also among the properties buyers get the fewest opportunities to purchase.
And that matters when you’re trying to establish value.
If houses rarely sell, the evidence is naturally thinner.
There isn’t really a single “most expensive road”
Whitecroft Way recorded one of the highest recent typical completed prices, at around £1.4 million.
Elwill Way was close behind.
You could therefore look at those figures and conclude that they are Park Langley’s “most expensive roads”.
But that would be too simplistic.
Because the houses aren’t the same.
Some roads contain much larger homes.
Some are almost entirely detached.
Some contain a much wider range of house sizes.
And some have far fewer recent transactions than others.
Once I looked at £ per square foot, the hierarchy changed again.
Roads with some of the biggest total sale prices didn’t necessarily achieve the highest rate per square foot.
And that led to one of the strongest findings in the entire study.
Bigger homes don’t command the same £ per square foot
This is probably the single statistic I would want a Park Langley homeowner to understand.
When I divided completed sales into groups based on the size of the house, the pattern was remarkably clear.
Homes below 1,750 sq ft achieved a typical rate of around:
£672 per sq ft
Between 1,750 and 2,250 sq ft:
£604
Between 2,250 and 2,750 sq ft:
£567
Between 2,750 and 3,500 sq ft:
£523
And above 3,500 sq ft:
£485
The larger the property became, the lower the rate buyers typically paid for each square foot.
From the smallest group to the largest, the difference was almost 28%.
That doesn’t mean larger houses are less valuable.
Far from it.
The largest homes still achieved considerably higher total prices.
But it does mean that value doesn’t increase in a straight line with floor area.
And that’s important.
Because one of the easiest ways to arrive at an unrealistic valuation is to take the £ per square foot achieved by a much smaller nearby property and simply multiply it by the floor area of a substantially larger house.
The evidence suggests buyers don’t behave that way.
More space adds value.
But each additional square foot appears to be worth progressively less.
There may also be a psychological reason for that.
A bigger house can mean more flooring, more decorating, larger kitchens, additional bathrooms, greater heating costs and potentially more extensive gardens to maintain.
Buyers don’t just see the extra space.
They may also mentally calculate what that space will cost to improve and maintain.
Even the same road can contain several different markets
The deeper I went into the data, the harder it became to justify the idea of a single road average.
On some roads, completed £-per-square-foot results vary enormously.
That might initially look strange.
But think about what can change between two houses only a few doors apart.
The plot.
The architecture.
The size.
The position within the road.
Whether it has been extended.
The quality of the extension.
The internal condition.
The layout.
The specification.
The garden.
And ultimately, how strongly buyers respond when it comes to market.
So a recent sale on the same road is useful evidence.
But it isn’t automatically the right comparable.
That’s a very important distinction.
A computer can identify nearby transactions.
The harder question is:
Why is this particular sale genuinely comparable to your home?
That’s where the investigation really begins.
The detailed individual transactions and road-by-road comparisons behind this are included in my separate Park Langley Property Statistics 2026 report.
Most of the Park Langley market isn’t £2 million+
Park Langley has some exceptional homes.
And it does produce £2 million-plus transactions.
But the numbers show very clearly where most actual buying and selling takes place.
Across the six-year period analysed, there were 172 completed sales.
Of those, 110 were between £1 million and £1.5 million.
That’s roughly two-thirds of the market.
Once you move beyond £1.5 million, the number of completed transactions falls quite quickly.
And above £2 million, completed sales become genuinely unusual.
That doesn’t mean a house isn’t worth £2 million, £2.5 million or more.
Some clearly are.
What it means is that the pool of evidence becomes much smaller.
And that changes the valuation process.
At £1.2 million, buyers may have numerous recent alternatives against which to compare a property.
At £2.2 million, there may be only a handful.
At that point, the individual house becomes much more important.
Its plot.
Its architecture.
Its condition.
Its setting.
Its presentation.
And ultimately the strength of buyer demand when it comes to market.
Did Park Langley prices really fall after 2022?
This is where headline property statistics can become misleading.
The typical completed sale price in the dataset was approximately:
2021 — £1.15m
2022 — £1.347m
2023 — £1.163m
2024 — £1.20m
2025 — £1.138m
Looking at those figures alone, you could easily conclude that Park Langley house prices surged in 2022 and then fell sharply afterwards.
But when I looked at the £-per-square-foot figures, the picture became much less dramatic.
The typical rate in 2022 was around £630 per sq ft.
By 2025 it was still around £630 per sq ft.
So why did the overall median sale price fall?
One explanation is simply that different houses were selling.
The typical property sold in 2022 was considerably larger than the typical property sold in 2025.
And that matters.
If a year happens to contain more large detached houses, the headline median price can rise.
If the next year contains more modest houses, it can fall.
That doesn’t necessarily mean the value of the same individual property moved by the same amount.
It is a useful reminder that:
an average house price isn’t the same thing as the value of your house.
What happens when a property doesn’t find its buyer early?
I also looked at a smaller sample of 168 current and recent marketing campaigns.
This part of the analysis needs more caution because Sprift does not contain a complete historical record of every Park Langley listing, withdrawal, relaunch and reduction.
So I wouldn’t describe this as a definitive measure of the whole market.
But the pattern within the available records is still interesting.
Tracked properties that secured a buyer without a recorded price reduction took a typical:
19 days
to reach Sold STC.
Those that eventually reduced took:
80 days.
That’s a very substantial difference.
And among the tracked homes that secured a buyer within the first 28 days, around 92% had not reduced their asking price.
That does not mean reducing a price causes a property to take longer to sell.
Usually the opposite sequence has already happened — the property has been sitting on the market before the decision is made to reduce.
But the figures do reinforce something I see repeatedly.
The beginning of a marketing campaign matters.
That’s when the listing is new.
That’s when the largest pool of buyers is likely to notice it.
And that’s when price, presentation, photography, positioning and marketing strategy all need to work together.
You can change those things later.
But you can’t make the property brand new to the market twice.
Long-term price growth needs context too
Some Park Langley properties have produced extraordinary differences between one historic sale and the next.
Over 20 or 30 years, six-figure purchase prices have sometimes become seven-figure sales.
But even here, the simplest conclusion isn’t necessarily the correct one.
A house can change enormously over that length of time.
It may have been extended.
Remodelled.
Modernised.
Reconfigured.
Or even substantially rebuilt.
So if a house was bought for £300,000 and later sold for £1.5 million, that doesn’t automatically mean the underlying market increased five-fold.
Part of the difference may be market growth.
Part may be additional floor area.
Part may be refurbishment.
Part may simply be that the property presented to the later buyer was fundamentally better than the one originally purchased.
Again:
the numbers are clues.
Not the whole answer.
What did analysing 1,066 Park Langley homes actually teach me?
Probably something quite simple.
Park Langley isn’t one market.
It is a collection of smaller markets sitting next to one another.
A large detached house on one road may appeal to a very different buyer from a smaller house only a few hundred metres away.
Different roads contain different property types.
Different house sizes command different rates per square foot.
Some roads see regular turnover.
Others may offer buyers only occasional opportunities.
The majority of transactions occur between £1 million and £1.5 million.
Above that, the comparable evidence becomes progressively thinner.
And even when two properties appear similar on paper, the detail can completely change how buyers perceive them.
Which is why I become uncomfortable when anyone tries to value a Park Langley home from:
one nearby sale
or
one £-per-square-foot figure
or
one online estimate.
They’re all useful pieces of evidence.
But none of them is the answer on its own.
You need to understand:
the road
the size
the plot
the condition
the architecture
the competition
the buyer pool
and
what the market is doing now.
Statistics can’t walk through your front door and value your home.
But they can give us a much clearer starting point.
And, perhaps more importantly, they help us ask better questions.
That’s the part I find fascinating.
Every property leaves clues.
Want to explore the actual numbers?
I’ve also created a separate Park Langley Property Statistics 2026 report.
That is deliberately different from this article.
This is my interpretation of what caught my attention.
The statistics report is where you’ll find the deeper road-by-road data, property sizes, £-per-square-foot figures, transaction history, ownership information, individual sales and other underlying evidence.
So if you’re the sort of person who enjoys diving into property statistics, that’s probably the one for you.
And if you live in Park Langley and you’re seriously considering a move, I can take the same approach much further at an individual property level.
Because that’s when the numbers become genuinely useful.
Clarity. Not optimism. Not guesswork. Just evidence.
About this analysis
This article is based on Land Registry completed-sale information alongside property and current/recent marketing information contained within Sprift.
The completed-sale evidence is substantially more comprehensive than the marketing data. The marketing information represents a current/recent snapshot rather than a complete historic archive, so figures relating to asking-price reductions and time to Sold STC should be treated as indicative.
Sprift also records current property floor areas. Where a property has subsequently been extended, remodelled or rebuilt, that floor area may differ from the accommodation that existed at an earlier sale date. Historic £-per-square-foot calculations should therefore be regarded as an analytical guide rather than an exact historic measurement.
This analysis is intended to provide property-market intelligence and context. It is not an RICS Red Book valuation and should not be relied upon as a formal valuation of an individual property.


Leave a comment