Q2 2026 · The first edition of a new quarterly benchmark for BR1, BR2 and BR3
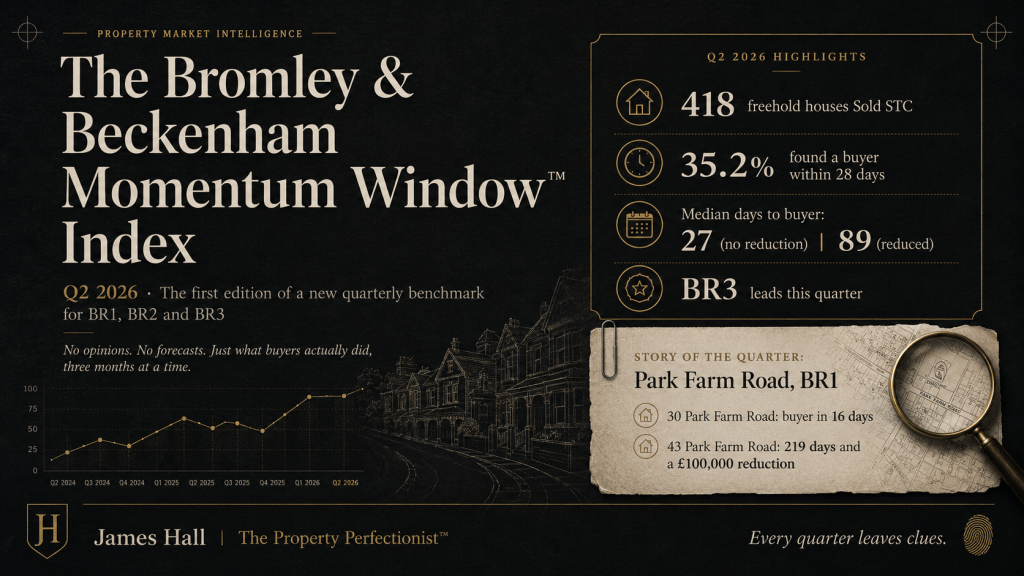
30 Park Farm Road, Bromley found a buyer in 16 days. No reduction. Full asking price.
43 Park Farm Road, the same road, a similar-sized detached house, took 219 days. It was cut by £100,000 along the way. It still completed for less than its neighbour asked for in the first place.
Same road. Comparable homes. A seven-month gap in outcome.
That’s not an isolated story. It’s the clearest illustration this quarter of a pattern I see repeating across BR1, BR2 and BR3, every three months, on almost every road. So I’ve decided to start tracking it properly, and publishing what I find.
Welcome to the first edition of the Bromley & Beckenham Momentum Window™ Index, a quarterly look at what’s actually happening to freehold houses across BR1, BR2 and BR3. Same methodology every time, so each edition can be read against the last. No opinions, no forecasts. Just what buyers actually did, three months at a time.
The headline: momentum is slowing, and pricing discipline matters more than it did a year ago
Across BR1 to BR3 combined, 418 freehold houses went Sold STC in Q2 2026.
| Metric | Q2 2026 | Q1 2026 | Q2 2025 |
|---|---|---|---|
| Buyer within 28 days | 35.2% | 39.7% | 42.2% |
| Median days, no reduction | 27 | 25 | 23 |
| Median days, reduced | 89 | 102 | 78 |
| Sellers who reduced before selling | 39.2% | 37.9% | 29.8% |
| Median reduction | £50,000 | £50,000 | £25,000 |
A year ago, 42.2% of homes here found a buyer within 28 days. This quarter, that’s down to 35.2%. The share of sellers needing a price cut before finding a buyer has climbed from around three in ten to almost four in ten, and the typical cut has doubled, from £25,000 to £50,000.
The one thing that hasn’t moved is the gap between the two groups. Correctly priced homes still find a buyer in about 27 days. Homes that need a reduction take about 89, roughly three times as long. If anything, that gap is now more expensive to fall on the wrong side of than it was a year ago.
Which area has the most momentum right now?
By buyer secured within 28 days:
🥇 BR3 — 40.3%
🥈 BR1 — 37.4%
🥉 BR2 — 28.9%
By speed to a buyer, correctly priced homes only:
🥇 BR3 — 22 days
🥈 BR1 — 25 days
🥉 BR2 — 32 days
BR3 takes the lead on both measures this quarter, the fastest 28-day conversion rate and the shortest time to a buyer for homes priced right from day one. BR2 is the area showing the most price resistance right now, the lowest 28-day rate and the highest share of sellers needing to reduce.
Does this hold at every price point?
| Price band | Buyer within 28 days | Median days to buyer | Needed a reduction |
|---|---|---|---|
| Under £500k | 47.1% | 34 | 32.4% |
| £500k–£750k | 32.7% | 43 | 36.8% |
| £750k–£1m | 35.0% | 52 | 43.0% |
| £1m+ | 30.4% | 60 | 45.6% |
Yes, consistently. Momentum is strongest at the lower end of the market and weakens steadily as price rises. Nearly half of sub-£500k homes find a buyer within a month. Above £1m, that drops to under a third, time to sale roughly doubles, and the odds of needing a reduction climb from around one in three to nearly one in two.
This isn’t a quirk of one price bracket. It’s a straight line, right across the market.
Is the market actually warming up, or slowing down?
| Measure | Q2 2026 | Q1 2026 | Q2 2025 |
|---|---|---|---|
| New listings | 589 | 616 | 526 |
| Sold STC | 425 | 352 | 335 |
| Conversion ratio | 0.72 | 0.57 | 0.64 |
Here’s the part that might seem to contradict everything above: demand is actually strengthening. New listings are up on a year ago, Sold STC volume is up on both comparisons, and the conversion ratio, how much of what comes to market is actually being absorbed, is at its highest point of the three periods measured.
Put together with the headline numbers, the picture is this: more homes are selling, but buyers are being considerably more selective about which ones, and at what price. That’s not a cooling market. It’s a market with real demand in it that’s punishing the wrong price harder than it used to.
The story of the quarter: Park Farm Road, Bromley
Every edition of this index will carry one real, named example, because a statistic tells you the pattern exists, but a real pair of houses tells you what it actually costs.
This quarter, it’s Park Farm Road, BR1.
| 30 Park Farm Road | 43 Park Farm Road | |
|---|---|---|
| Type | Detached, 5 bed, 2,002 sq ft | Detached, 4 bed, 1,894 sq ft |
| Listed | 31 March 2026 | 30 September 2025 |
| Original asking price | £1,350,000 | £1,200,000 |
| Reductions | None | −£100,000 (−8.3%) |
| Days to Sold STC | 16 | 219 |
| Completed price | £1,200,000 | £1,100,000 |
Two detached houses, the same road, within about 110 sq ft of each other in size. No. 30 launched at a price the market was ready to meet, and had a buyer inside a fortnight. No. 43 launched, met resistance, sat through the winter and spring, and only found a buyer after a £100,000 cut, 203 days later than its neighbour.
The quarter’s data says this over and over, in every table above. This is what it looks like on one actual street.
What this means if you’re thinking of selling this quarter
- The gap between pricing right and pricing hopefully is now wider than it was a year ago. A reduction today costs more, on average, than the same mistake would have a year ago.
- BR3 currently has the most momentum, BR2 the least. Worth knowing which side of that line your own road sits on before you set a guide price.
- The higher your price bracket, the more this matters. Above £1m, fewer than one in three homes secure a buyer within a month, and the odds of a reduction are closing in on half.
- The market has genuine demand in it right now. This isn’t a story about buyers disappearing. It’s a story about buyers being more selective, and rewarding the homes that make the decision easy for them.
I’ll be publishing this every quarter, same format, same methodology, so you can watch how BR1, BR2 and BR3 actually move over time, not just read a single snapshot.
If you’re weighing up when to launch, or want to know exactly where your own road sits against this quarter’s numbers, I’m happy to talk it through.
James Hall | The Property Perfectionist™
Every quarter leaves clues.
📞 07855 828 736
🌐 propertyperfectionist.co.uk


Leave a comment