Property Perfectionist – James Hall
152 houses. Only 20 marketed in five years. 19 secured a buyer. And the difference between properties that reduced and those that didn’t is difficult to ignore.
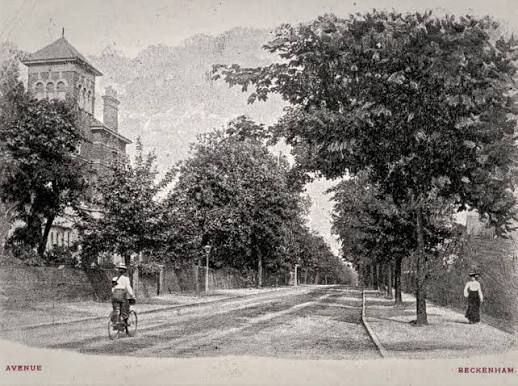
If you own a house on Wickham Way, here’s a question worth sitting with for a moment.
Two houses on your road tell two completely different stories about what happens when a home comes to market. One found a buyer in 2 days. The other took 335 days, was cut by £300,000, and still sold for £400,000 less than it was first asked.
Same road. Similar houses. Wildly different outcomes.
I wanted to understand why, not by guessing, but by going through the evidence: every house marketed on Wickham Way in the last five years, ten years of Land Registry completions, and the pattern behind who sold fast and who didn’t.
Here’s what the data actually shows.
A road built on bigger ambitions
Wickham Way was one of the first roads built as part of Park Langley, a garden suburb development that began after much of the old Langley Park Estate was bought in 1908. The original plan was bigger than housing alone: a circular shopping parade, a church, even a dance hall were on the drawing board before the First World War intervened and much of that vision was quietly shelved.
More than a century later, Wickham Way is still overwhelmingly detached and semi-detached. And, as the numbers below show, it’s a road where people tend to stay put.
Wickham Way at a glance
| Metric | Wickham Way |
|---|---|
| Residential houses | 152 |
| Detached | 95 |
| Semi-detached | 57 |
| Terraced | 0 |
| Marketed in last 5 years | 20 houses (13.2% of the road) |
| Secured a buyer | 19 of 20 (95%) |
| Completed sales, last 5 years | 17 (11.2% of the road) |
| Median time to Sold STC | 23 days |
| Median £/sq ft, detached | £664 |
| Median £/sq ft, semi-detached | £587 |
| Highest sale ever recorded | £2,250,000 |
| Highest sale, last 5 years | £1,730,000 |
Seven out of every eight houses on this road haven’t come to market at all in five years. That’s not a quiet market. It’s a tightly held one. And it matters if you’re thinking of selling: when a Wickham Way house does appear, there’s comparatively little on-road competition for buyer attention.
What happens when a Wickham Way house comes to market
Of the 20 houses marketed in the last five years, 19 secured a buyer, a 95% strike rate, with only one recorded as withdrawn. That’s strong evidence of genuine underlying demand.
(One older Sold STC, at 1 Wickham Way, looks stale and may not represent a genuine sale, so treat the 95% as strong evidence of demand, not a guarantee.)
But the number that matters most to a seller isn’t the 95%. It’s what happened in the opening weeks.
The £400,000 lesson
Two houses make the point better than any statistic could.
152 Wickham Way, a four-bedroom semi-detached house at 1,916 sq ft, was listed at £1,125,000 on 11 April 2024. It was Sold STC two days later. No reduction. It completed at £1,075,000.
13 Wickham Way, a four-bedroom detached house at 2,164 sq ft, was listed at £1,800,000 in December 2022. It took 335 days to find a buyer, and only after a £300,000 (16.67%) reduction. It eventually completed at £1,400,000, a £400,000 gap between the original asking price and what the house actually sold for.
Two houses. One road. A £400,000 difference in outcome.
That gap is the entire argument for getting the launch right.
Why the first 28 days decide so much
Of the 19 houses that secured a buyer:
- 6 did so within 14 days
- 10 did so within 28 days
- 12 within 42 days
- 15 within 90 days
Here’s the statistic that really caught my attention: all 10 houses that found a buyer within 28 days did so without reducing their price. Every single one.
Split the successful sales into two groups and the pattern sharpens further:
- Houses that didn’t reduce: median 15 days to secure a buyer
- Houses that reduced: median 106 days, roughly seven times longer
This is a small sample (only five reduced properties), so treat it as a road-specific pattern rather than a universal law. But it’s a striking one, and it matches what tends to hold true more broadly: a reduction rarely causes a slow sale. It’s usually the symptom of a launch that didn’t generate enough interest the first time.
What this means if you’re selling: the offer you get in week one is often the best offer you’ll get. Sellers who reduced on Wickham Way typically waited 100 days before doing so, by which point the freshest, most engaged pool of buyers had already moved on to something else.
When sellers did reduce, it wasn’t small
- Median reduction: £70,000, about 5.13% of asking
- (The average was higher, £134,000 / 9.6%, but that’s skewed by a couple of large cuts, so the median is the fairer number)
- Median time before that first reduction: 100 days
Sellers on Wickham Way weren’t reacting after two or three weeks. They were typically spending more than three months watching a campaign lose steam before changing course. By then, something important had already been lost: the freshness that only exists the first time a property appears.
I call those opening weeks the Momentum Window™, and Wickham Way is about as clean a real-world illustration of it as I’ve found.
Detached vs semi-detached: what £/sq ft tells us
Using completed sales from the last five years with reliable floor-area data:
| Median £/sq ft | Sample | |
|---|---|---|
| Detached | £664 | 9 sales |
| Semi-detached | £587 | 8 sales |
| All Wickham Way houses | £655 | 17 sales |
Detached stock is commanding around 13% more per square foot than semi-detached. That’s a useful cross-check when weighing up value, but it’s not a valuation method on its own. Condition, plot, extension quality, position on the road and internal presentation can all move that figure considerably in either direction.
The five strongest £/sq ft results on the road in the last five years:
| Address | Sale price | Floor area | £/sq ft |
|---|---|---|---|
| 59 Wickham Way | £1,730,000 | 2,357 sq ft | £734 |
| 166 Wickham Way | £1,000,000 | 1,410 sq ft | £709 |
| 148 Wickham Way | £1,050,000 | 1,496 sq ft | £702 |
| 75 Wickham Way | £1,275,000 | 1,830 sq ft | £697 |
| 116 Wickham Way | £1,197,000 | 1,722 sq ft | £695 |
(Floor areas are current EPC data and may not perfectly reflect a property’s size at the time of an older sale. Useful evidence, but not to be used in isolation.)
The record books
The highest completed sale ever recorded on Wickham Way was £2,250,000, at 33 Wickham Way in October 2020, still the road’s benchmark five years on.
The five highest completed sales of the last five years:
| Address | Completion | Price |
|---|---|---|
| 59 Wickham Way | Mar 2022 | £1,730,000 |
| 9 Wickham Way | May 2023 | £1,650,000 |
| 190 Wickham Way | Nov 2025 | £1,500,000 |
| 13 Wickham Way | Feb 2024 | £1,400,000 |
| 75 Wickham Way | Jun 2025 | £1,275,000 |
That spread, from £1.275m to £1.73m, is a reminder that “the average Wickham Way house” isn’t really a useful idea. Buyers compare specific properties, not road averages.
2025: the busiest year in a decade
| Year | Sales | Median price |
|---|---|---|
| 2021 | 1 | £1,385,000 |
| 2022 | 2 | £1,115,000 |
| 2023 | 3 | £1,145,000 |
| 2024 | 3 | £1,075,000 |
| 2025 | 9 | — |
Nine completions in a single year, on a road that normally sees one to three, is a real shift. Not necessarily a sign that prices have jumped, but clear evidence that considerably more stock has actually changed hands. On a tightly held road, that’s worth noticing if you’ve been waiting for the “right time” to test the market.
Not every price rise is the market’s doing
Only two Wickham Way houses sold more than once in the last ten years, again evidence of just how tightly this road is held.
59 Wickham Way: £1,325,000 (Oct 2020) → £1,730,000 (Mar 2022), a 30.6% increase in 17 months. That is not ordinary market growth. The property has multiple planning records, and a jump that size over such a short period strongly points to genuine improvement or extension work between sales, not the market alone.
116 Wickham Way: £975,000 (Feb 2019) → £1,197,000 (Aug 2025), a 22.8% increase, equivalent to roughly 3.2% a year. That’s a far more plausible read of underlying, organic growth on this road.
The lesson for any seller trying to gauge what their own house might be worth: don’t assume every eye-catching number down the road is pure market movement. Some of it was earned through work on the property, not just time.
What this means if you’re thinking of selling
- You’re on a scarce road. Only 13.2% of Wickham Way has come to market in five years. When your house appears, it won’t have much on-road competition.
- Demand is strong when houses do launch. 95% of marketed houses found a buyer.
- Your first four weeks matter more than anything that happens afterwards. Every house that sold within 28 days did so at full asking price. Every reduction happened after a slow start.
- A late reduction is expensive. The typical cut, once it came, was £70,000, and it followed three months of lost momentum, not a snap decision.
- Detached commands a real premium per square foot, but presentation, condition and positioning still move the number more than size alone.
- Not all “growth” is market growth. If you’re benchmarking your own equity gain against a neighbour’s sale, check whether they extended or refurbished first.
None of this means every Wickham Way house needs to be priced low, or has to sell within 28 days. Property is more nuanced than a single rule. What the evidence does say is that the launch deserves far more thought than picking a number and uploading some photos to Rightmove.
Thinking of selling on Wickham Way?
If you’re considering a move, I’m happy to prepare an individual Property Perfectionist™ Market Intelligence Review for your specific house: your size and specification, relevant completed sales, £/sq ft evidence, current competition, buyer behaviour, presentation and how I’d approach the launch.
Not an automated valuation. Not optimism. Not a number designed to win an instruction.
Evidence first.
I’m James Hall, The Property Perfectionist™.
Every road leaves clues.
📞 07855 828 736
🌐 propertyperfectionist.co.uk
Data source: Sprift property intelligence, incorporating AddressBase, Land Registry Price Paid, portal marketing and EPC information. Figures relate to the rolling periods stated and should be treated as market intelligence rather than a formal valuation. Sold STC data can change where transactions fall through or properties are subsequently re-marketed. £/sq ft calculations use available EPC floor-area information and should be regarded as indicative. This article represents an independent professional opinion and is not an RICS Red Book valuation.


Leave a comment