Why the opening weeks of a property launch may matter more than most sellers realise
If you’re thinking of selling your home, one of the most common pieces of advice you’ll hear is:
“Let’s put it on the market and see what happens.”
But what if those opening weeks are actually the most valuable part of the entire campaign?
What if the point at which your property is newest, attracting fresh alerts, first clicks, first viewings and the greatest concentration of buyer attention has a measurable relationship with the price you eventually achieve, the likelihood of reducing and even whether the transaction ultimately completes?
I’ve been investigating exactly that.
I analysed 14,348 matured house marketing campaigns across BR1, BR2, BR3, BR4, BR5, BR6 and BR7, covering the five years to August 2026.
Houses only. Flats, apartments and maisonettes were excluded.
And importantly, recent listings which hadn’t yet been on the market long enough to produce a meaningful outcome were removed from the core analysis.
The question was simple:
Do houses that secure a buyer within their first 28 days tend to produce better outcomes for sellers than those that take longer?
The answer isn’t quite as simple.
Because this is observational market data, not a controlled experiment.
But the pattern is remarkably consistent.
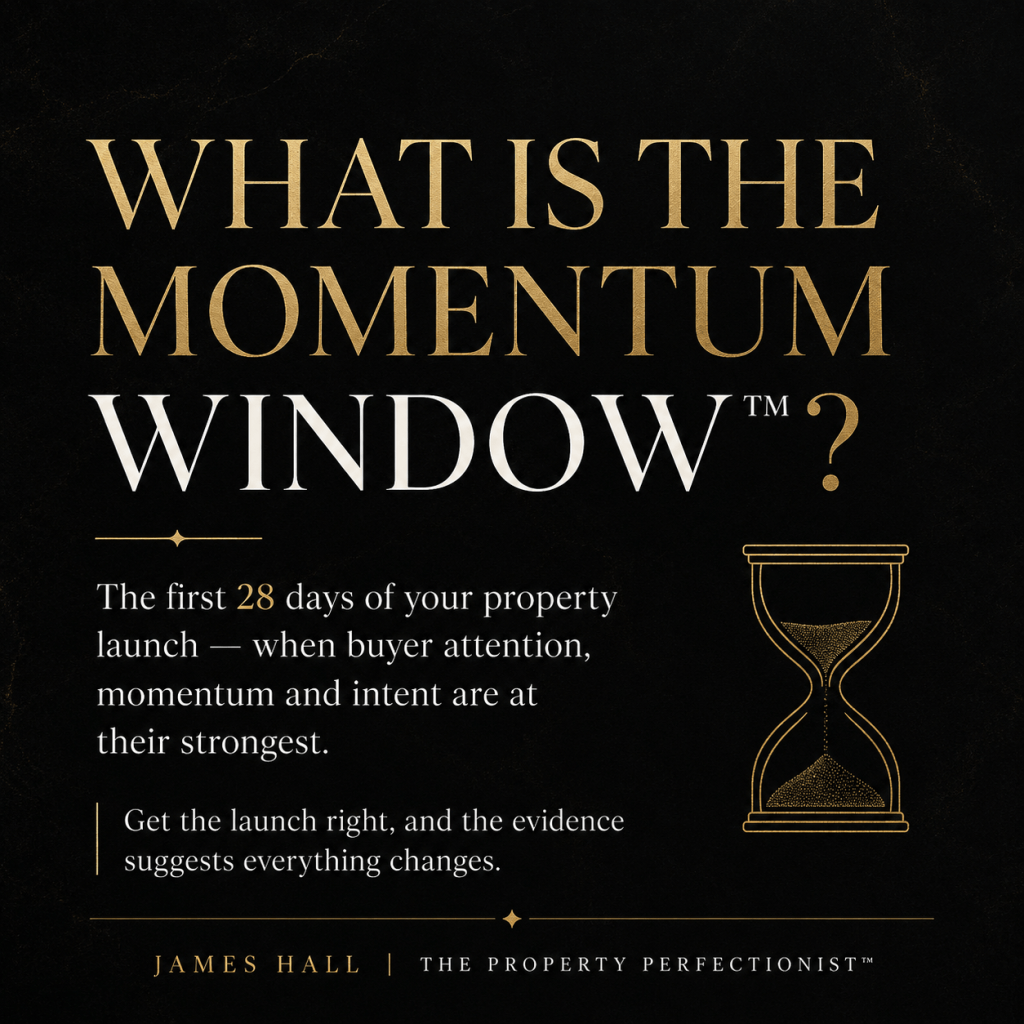
I call those opening weeks the Momentum Window™.
_____________________________________________________________________________________
Don’t want to read all the stats? Here’s the short version.
I analysed 14,348 matured house marketing campaigns across BR1–BR7.
The pattern was remarkably consistent:
Homes that secured a buyer within 28 days tended to achieve more of their original asking price, were far less likely to reduce, had fewer fall-throughs and completed sooner.
Within 28 days, sellers achieved a median 99.6% of original asking price versus 95.3% after 28 days. They reduced just 7.9% of the time versus 53.9%, while fall-through rates were 11.7% versus 33.4%.
And when reductions did happen, 76.3% came after day 28, with the typical first reduction arriving around day 55.
So the message is simple:
Don’t “test the market”.
Your first few weeks are potentially your most valuable.
That’s your Momentum Window™.
Your launch isn’t the warm-up. It’s the event.
The headline finding: 99.6% versus 95.3%
Let’s start with perhaps the most important statistic.
Across BR1–BR7, houses that secured a buyer within 28 days subsequently completed at a median:
99.6% of their original asking price
Properties taking longer than 28 days completed at:
95.3% of their original asking price
That’s a difference of 4.3 percentage points in original asking-price retention.
Put that percentage gap into real-world numbers and it becomes easier to understand:
| Original asking price | 4.3 percentage-point equivalent |
|---|---|
| £500,000 | £21,500 |
| £750,000 | £32,250 |
| £1,000,000 | £43,000 |
| £1,500,000 | £64,500 |
| £2,000,000 | £86,000 |
That does not mean being on the market beyond day 28 automatically costs a seller that amount.
It would be wrong to make that claim.
The slower properties may have started too high, been less well presented, had unusual layouts, needed refurbishment or simply appealed to a smaller buyer pool.
But that’s precisely why time on market is so useful.
Time on market is feedback.
The first 28 days affect more than price
When I compared properties securing buyers within 28 days with those taking longer, the differences went well beyond asking-price retention.
| Measure | Buyer within 28 days | Buyer after 28 days |
|---|---|---|
| Median days to buyer | 13 | 83 |
| Reduced before Sold STC | 7.9% | 53.9% |
| Median completed price vs original asking | 99.6% | 95.3% |
| Completion rate | 83.0% | 74.4% |
| Fall-through rate | 11.7% | 33.4% |
| Median launch to completion | 124 days | 192 days |
The later-selling group took a median 68 additional days to travel from launch to completion.
And there was another statistic that caught my attention.
Properties taking longer than 28 days were around 6.8 times more likely to have reduced before securing a buyer.
Again, that doesn’t mean the reduction caused the slower sale.
More plausibly, the reduction was often a response to the campaign already struggling to generate enough early engagement.
That distinction matters.
What happens as the campaign gets older?
Rather than simply comparing “under 28 days” and “over 28 days”, I wanted to see what happened at each stage.
The completed-price data produced a striking pattern:
| Time taken to secure buyer | Median completed price as % of original asking |
|---|---|
| 14 days or less | 100.0% |
| 15–28 days | 98.3% |
| 29–60 days | 96.6% |
| 61–90 days | 95.4% |
| 91–120 days | 94.7% |
| 120+ days | 93.4% |
That’s what makes the data particularly interesting.
The result doesn’t suddenly collapse on day 29.
Instead, the relationship is progressive.
The longer it takes to secure a buyer, the lower the eventual completed price tends to be relative to the property’s original asking price.
That’s why I use the word momentum.
Momentum doesn’t disappear instantly.
It fades.
So why 28 days?
I deliberately wanted the data to challenge the idea.
If the real turning point was day 21, day 35 or day 42, I wanted to know.
The analysis found that the decline is progressive rather than there being one dramatic cliff edge.
But it also identified a meaningful behavioural change around the 28-day point, with risk becoming noticeably greater as properties move towards days 42–56.
That gives us a useful way of thinking about a property campaign:
Day 1 — Novelty
Your property is new.
Alerts go out.
Portal users notice it.
Potential buyers who’ve been waiting for the right home see it for the first time.
Day 14 — Momentum
The initial market response should now be becoming clearer.
Are buyers clicking?
Booking?
Viewing?
Returning for second visits?
Making offers?
Day 28 — Decision Point
If a serious buyer hasn’t emerged, the question becomes:
What is the market trying to tell us?
Around Day 55 — Typical first reduction
And this is where another major finding appears.
Most price reductions happen after the Momentum Window™
Across 4,453 reduced properties, approximately:
76.3% of first price reductions happened after day 28.
The median first price reduction occurred at approximately:
Day 55
The median reduction was:
£35,000 or 5.56%
And after reducing, sellers still waited a median 32 further days before securing a buyer.
That’s potentially one of the most important findings for sellers.
Because it suggests many campaigns follow this sequence:
Launch.
Wait.
Wait some more.
Momentum weakens.
Eventually reduce.
Then wait again.
The interesting question is whether some of that lost time — and potentially lost negotiating position — could have been avoided by making better decisions at the beginning.
What happens if a buyer hasn’t been secured by day 28?
There were 10,391 matured campaigns still without a buyer at day 28.
Of those:
61.2% subsequently secured a buyer
43.5% eventually reduced their asking price
14.3% withdrew
The median first reduction occurred at around day 54, and the median reduction was approximately £35,000 / 5.56%.
And the longer a property remained unsold, the picture continued to change.
Among properties still without a buyer:
| Still unsold after | Subsequently secured buyer | Eventually withdrew |
|---|---|---|
| Day 7 | 70.5% | 11.1% |
| Day 14 | 66.8% | 12.5% |
| Day 21 | 63.8% | 13.5% |
| Day 28 | 61.2% | 14.3% |
| Day 42 | 56.7% | 15.9% |
| Day 56 | 52.6% | 17.3% |
| Day 84 | 43.7% | 20.4% |
That’s an important distinction.
I’m not saying:
“Your property won’t sell after 28 days.”
Clearly, many do.
I’m saying:
The evidence suggests the probability and quality of the eventual outcome begin to change as the campaign ages.
But aren’t cheaper properties simply easier to sell?
That was an obvious question.
So I asked the data to control for price.
The same broad pattern appeared in every price band analysed.
| Original asking-price band | Buyer ≤28 days | Buyer >28 days |
|---|---|---|
| Under £500k | 100.0% | 95.8% |
| £500k–£750k | 100.0% | 95.5% |
| £750k–£1m | 99.3% | 95.5% |
| £1m–£1.25m | 98.5% | 93.0% |
| £1.25m–£1.5m | 97.5% | 93.1% |
| £1.5m–£2m | 97.4% | 93.3% |
| £2m+ | 97.1% | 92.5% |
These figures show median completed price as a percentage of the original asking price.
That matters because the Momentum Window™ pattern isn’t confined to entry-level houses.
In fact, the percentage-point gap becomes slightly larger towards the upper end.
And it isn’t simply one type of house
The same test was repeated by property type.
Again, the direction remained consistent.
| House type | Buyer ≤28 days | Buyer >28 days |
|---|---|---|
| Detached | 98.1% | 93.9% |
| Semi-detached | 100.0% | 95.5% |
| Terraced | 100.0% | 96.0% |
| Bungalow | 98.8% | 94.5% |
So this isn’t simply a case of cheaper terraces selling quickly while expensive detached homes take longer.
The same broad relationship appears across the main property types.
The £1m+ market may be even more interesting
Because much of my work involves higher-value homes, I wanted to look at the premium market separately.
For properties originally marketed at £1 million or more:
| £1m+ homes | Buyer ≤28 days | Buyer >28 days |
|---|---|---|
| Reduced | 9.4% | 51.5% |
| Completed % of original asking | 97.9% | 93.0% |
| Completion rate | 74.6% | 69.5% |
| Fall-through rate | 12.8% | 30.9% |
And for properties marketed at £1.5 million+:
| £1.5m+ homes | Buyer ≤28 days | Buyer >28 days |
|---|---|---|
| Reduced | 11.0% | 50.2% |
| Completed % of original asking | 97.4% | 92.9% |
| Completion rate | 71.7% | 62.9% |
| Fall-through rate | 15.0% | 31.4% |
The sample at the very top end is naturally smaller, so those numbers need treating with more caution.
But the direction remains the same.
And for a seller of a £1m, £1.5m or £2m home, even a few percentage points in asking-price retention can represent a very substantial sum.
Price correctly now or reduce later?
I also compared two broader groups.
Properties that never reduced before securing their buyer, versus those that reduced and then secured one.
The results:
| Never reduced | Reduced then secured | |
|---|---|---|
| Sample | 6,576 | 3,742 |
| Median original asking | £625,000 | £650,000 |
| Completed % of original asking | 98.9% | 92.8% |
| Median days to buyer | 24 | 96 |
| Median launch to completion | 144 | 203 |
| Completion rate | 80.8% | 72.2% |
Again, it would be wrong to say:
“Reducing causes you to lose money.”
The properties that needed reducing may have been incorrectly priced in the first place or harder to sell for other reasons.
But from a strategic perspective, that is precisely why the launch deserves so much attention.
The objective shouldn’t be:
“How high can we start?”
It should be:
“What strategy gives this property the strongest possible chance of generating maximum buyer engagement while it is at its freshest?”
Your launch isn’t the warm-up
This is ultimately what the Momentum Window™ means to me.
A launch is not simply the moment an estate agent uploads photographs to Rightmove.
It’s the culmination of:
Pricing
Presentation
Photography
Video
Storytelling
Portal positioning
Social-media exposure
Buyer database preparation
Viewing strategy
Negotiation
Get those elements working together and you give the property the best opportunity to convert early attention into real buyer competition.
Get one or several of them wrong and waiting another eight or ten weeks before changing strategy might mean trying to solve the problem after the property’s most valuable period of novelty has already passed.
Is 28 days a magic number?
No.
And I think that’s important to say.
A house doesn’t become undesirable at midnight on day 28.
Nor does every property need to sell within four weeks.
Prime, unusual and highly individual homes may naturally have smaller buyer pools.
But when I asked the analysis to look for evidence against the Momentum Window™ concept, no postcode district, house type or price band reversed the overall direction.
BR2 showed a slightly weaker early-sales pattern than some of the other postcode districts, while premium homes naturally attracted more negotiation even when they sold quickly.
But slower campaigns did not outperform faster ones on original asking-price retention in any of the segments tested.
Across the entire dataset, the evidence was graded Strong rather than “Very Strong” because it remains observational.
That is exactly the distinction I would make too.
Would I expect this beyond BR1–BR7?
Yes.
This particular study covers the Bromley postcode area, so I wouldn’t present the numbers as if they automatically apply to every London borough.
However, I would expect similar broad patterns to emerge across many other London markets, where sellers are exposed to the same fundamental portal dynamics, buyer comparisons and loss of listing novelty.
That is something I intend to continue investigating.
What should a seller take from all this?
Not:
“My house has to sell in 28 days.”
Instead:
The first 28 days deserve considerably more thought than simply putting the property online and waiting.
If the market responds strongly, the evidence suggests sellers are more likely to:
secure a buyer sooner,
retain more of their original asking price,
avoid subsequent price reductions,
experience fewer fall-throughs,
and complete sooner.
If the response is weak, the answer isn’t necessarily an immediate price reduction.
But by day 28, there should be enough evidence to start asking serious questions.
Are buyers clicking?
Are they booking viewings?
Are viewings converting into second visits?
What objections keep appearing?
How does the home compare with the competition?
Is the photography strong enough?
Is the presentation helping?
Is the asking price attracting the right buyer pool?
Has the marketing actually created a reason to act?
Because by the time the typical seller in this dataset made their first reduction at around day 55, the original Momentum Window™ had already passed.
The Property Perfectionist™ view
The data doesn’t tell me that every seller should chase a quick sale.
It tells me something more useful.
Early buyer engagement appears to be associated with better outcomes.
And that relationship persists across:
seven postcode districts,
seven price bands,
all four main house types,
and a dataset containing 14,348 matured property campaigns.
That makes the opening weeks too important to treat casually.
So if you’re thinking of selling, my question wouldn’t be:
“What price can we put it on for?”
It would be:
“What do we need to do before day one to maximise the Momentum Window™?”
Because you can change your price later.
You can change your photographs.
You can change your agent.
You can rewrite the description.
You can change the strategy.
But there’s one thing you cannot recreate.
The moment your property is genuinely new to the market.
That is your Momentum Window™.
Use it well.
James Hall | The Property Perfectionist™
If you’re considering selling a property in Bromley, Beckenham or the surrounding area and would like an evidence-led assessment of your likely market position and launch strategy, call or message me on 07855 828 736.
Every property leaves clues.
Clarity. Not optimism. Not guesswork. Just evidence.


Leave a comment