A Road Where Properties Rarely Become Available
The Property Perfectionist™ Road Intelligence
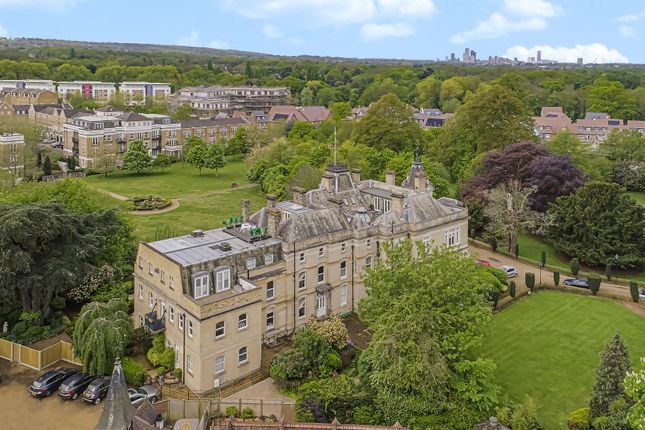
43 houses. Around 72% owned for more than 10 years. One in three apparently held for at least 25 years. And the highest sale for almost two decades completed in 2025.
I’ve been investigating Bucknall Way in Beckenham, and the more closely I looked at the evidence, the more interesting the road became.
This isn’t simply a story about house prices.
It’s a story about scarcity, longevity, size, improvement and what happens when the right property comes to market with the right strategy.
Because every road leaves clues.
Let’s look at the evidence.
First, a little Bucknall Way history
The name itself appears to have a fascinating connection with the history of the wider Langley estate.
The modern Langley Court was built in around 1886 on the site of the former Langley Farm. Contemporary local history records describe James Loyd Bucknall, a shipowner, as the man who built and occupied it. An account published in Robert Borrowman’s Beckenham Past and Present in 1910 also records Langley Court as the residence of J. L. Bucknall.
Langley Court subsequently had an extraordinary second life. Local historical records report that it was used as a prisoner-of-war camp during the First World War, before being taken over by the Wellcome Foundation Laboratories in 1920, which developed the site for medical research.
The former Wellcome site was eventually sold for redevelopment in the 1990s, becoming part of today’s gated Park Langley development.
I haven’t found an original road-naming document proving that Bucknall Way was specifically named after James Loyd Bucknall, so I wouldn’t present that as absolute fact. But given the location and the historic Bucknall association with Langley Court, the connection appears a very plausible one.
More than a century later, however, another characteristic stands out.
People don’t seem to leave Bucknall Way very often.
Bucknall Way at a glance
| Road intelligence | Finding |
|---|---|
| Individual houses | 43 |
| Detached houses | 34 |
| Semi-detached houses | 6 |
| Dairy Cottages | 3 |
| Freehold houses | 43 / 100% |
| Houses owned 10+ years | 31 / 72% |
| Houses owned 15+ years | 24 / 56% |
| Houses owned 20+ years | 18 / 42% |
| Houses owned 25+ years | 14 / 33% |
| Houses openly marketed in last 5 years | around 7 |
| Recent completed-sales median £/sq ft* | ~£592 |
| Detached median £/sq ft* | ~£595 |
| Highest sale in last 10 years | £2.05m |
| All-time recorded road high | £2.20m |
*Recent completed house sales with usable floor-area evidence, excluding the anomalous sale at 14 Bucknall Way.
The road contains 43 individual houses, of which 34 are detached and six semi-detached, alongside the three Dairy Cottages. All 43 are recorded as freehold.
The first clue: Bucknall Way is exceptionally tightly held
This is probably the statistic that surprised me most.
Of the 43 houses:
31 — around 72% — appear to have been owned for at least 10 years.
24 — 56% — for at least 15 years.
18 — 42% — for at least 20 years.
And 14 properties — roughly one in every three houses on the road — appear not to have changed hands for at least 25 years.
That matters.
Because property values aren’t determined only by size, condition and postcode.
Scarcity matters too.
When buyers looking specifically for a particular road have very few opportunities to purchase there, a well-presented property can become considerably more interesting simply because alternatives are limited.
And Bucknall Way appears to be a textbook example.
Only around seven individual houses have been openly marketed during the last five years.
So a buyer could potentially wait years for the right Bucknall Way house to become available.
£2 million is back
Another interesting clue appeared in October 2025.
5 Bucknall Way completed at £2,050,000.
It was a substantial seven-bedroom detached house of approximately 3,434 sq ft, and it had originally been marketed at £2 million.
It eventually completed £50,000 above the asking price.
That made it the highest completed Bucknall Way house sale for approximately 19 years.
But it wasn’t the road record.
That still belongs to 1 Bucknall Way, which sold for £2.2 million in September 2006.
That distinction is important.
Rather than claiming a new record, the evidence tells us something arguably more interesting:
After almost two decades, Bucknall Way has once again demonstrated that buyers will pay more than £2 million for the right house.
Recent high-value sales
Some of the strongest recorded Bucknall Way house transactions include:
| Property | Completed price |
|---|---|
| 1 Bucknall Way | £2,200,000 |
| 5 Bucknall Way | £2,050,000 |
| 54 Bucknall Way | £1,700,000 |
| 44 Bucknall Way | £1,680,000 |
| 34 Bucknall Way | £1,650,000 |
| 9 Bucknall Way | £1,630,000 |
| 36 Bucknall Way | £1,525,000 |
The evidence reinforces something that becomes clearer when we look at floor areas:
buyers appear prepared to pay very substantial headline prices for Bucknall Way’s larger houses.
What does a square foot cost on Bucknall Way?
Looking at usable completed house sales from the last five years, excluding one highly anomalous transaction, the evidence produced:
Median across houses: approximately £592 per sq ft
Median detached: approximately £595 per sq ft
Individual recent results include approximately:
| Property | Approx. £/sq ft |
|---|---|
| 44 Bucknall Way | £673 |
| 34 Bucknall Way | £647 |
| 5 Bucknall Way | £597 |
| 6 Bucknall Way | £592 |
| 54 Bucknall Way | £564 |
| 9 Bucknall Way | £553 |
The evidence broadly clusters between approximately £550 and £675 per sq ft for the conventional houses in the sample.
That tells us something useful.
The biggest Bucknall Way numbers don’t appear to come simply from forcing buyers to pay ever-higher rates per square foot.
They come largely from having more square feet to sell.
So when comparing two Bucknall Way houses, asking only how many bedrooms they have isn’t enough.
Floor area can be crucial.
Buyers compare.
Same road. Very different results.
This is where the investigation gets particularly interesting.
Four Bucknall Way houses have repeat transactions within the last decade:
| Property | Earlier purchase | Later sale | Increase |
|---|---|---|---|
| 6 Bucknall Way | £933,000 | £1,275,000 | +36.7% |
| 54 Bucknall Way | £1,275,000 | £1,700,000 | +33.3% |
| 34 Bucknall Way | £1,275,000 | £1,650,000 | +29.4% |
| 9 Bucknall Way | £1,500,000 | £1,630,000 | +8.7% |
Those are enormous differences.
The ownership periods aren’t wildly different — but the outcomes are.
And that is exactly why I dislike relying too heavily on generic percentages such as:
“Prices in this area have risen X%.”
Properties aren’t index funds.
Condition changes.
Floor area changes.
Owners extend.
Layouts improve.
Kitchens and bathrooms are replaced.
Gardens are landscaped.
And, importantly, one owner might have bought particularly well while another paid close to the prevailing ceiling.
Sprift’s analysis suggests that 6 Bucknall Way, which rose around 37%, had planning activity shortly after its 2019 purchase, whereas 9 Bucknall Way was already a substantial six-bedroom home bought for £1.5 million and subsequently increased by only around 9%.
So perhaps the better question isn’t:
“How much has Bucknall Way gone up?”
It’s:
“What has happened to properties genuinely comparable to mine?”
What happens when a Bucknall Way house launches?
Now we get to the part I find particularly interesting.
The sample is small — only seven clearly dated house marketing campaigns during the five-year period — so these results should be considered indicative rather than treated as a statistical certainty.
But the pattern is difficult to ignore.
The three fastest conventional Bucknall Way house campaigns secured buyers in approximately:
7 days — 6 Bucknall Way
12 days — 44 Bucknall Way
13 days — 5 Bucknall Way
And crucially:
None reduced their asking price first.
That’s important because the eventual completed prices were also remarkably close to their original asking prices.
Asking price versus eventual sale price
| Property | Original asking | Completed | Difference | Time to buyer |
|---|---|---|---|---|
| 5 Bucknall Way | £2,000,000 | £2,050,000 | +2.5% | ~13 days |
| 44 Bucknall Way | £1,700,000 | £1,680,000 | −1.2% | 12 days |
| 6 Bucknall Way | £1,300,000 | £1,275,000 | −1.9% | 7 days |
| 34 Bucknall Way | £1,800,000 | £1,650,000 | −8.3% | 31 days |
| 9 Bucknall Way | £1,700,000 | £1,630,000 | −4.1% | ~78 days |
The three houses securing buyers within 28 days collectively completed at approximately 99.8% of their original asking prices.
Effectively, almost 100%.
By comparison, the two conventional houses taking between 29 and 90 days ultimately completed around 6.2% below their original asking prices on average.
Again: small sample.
Correlation isn’t causation.
But it’s useful evidence.
The Momentum Window™
This is why I keep talking about the Momentum Window™.
A property generally receives its greatest concentration of attention when it first appears.
It’s new.
Potential buyers receive alerts.
People who have been waiting for that particular road notice it.
Other agents notice it.
Buying agents notice it.
And buyers begin making comparisons.
On Bucknall Way, the three fastest recent house campaigns all secured buyers within approximately two weeks, without reducing their asking prices first.
That doesn’t prove every correctly launched Bucknall Way home will sell in a fortnight.
But it reinforces something I see repeatedly:
You don’t get a second chance to be a brand-new listing.
Price.
Presentation.
Photography.
Storytelling.
Marketing.
Strategy.
They all need to work together from day one.
What about price reductions?
Interestingly, amongst the seven clearly dated marketing campaigns, there was only one genuine recorded price reduction — and that involved one of the Dairy Cottages rather than a conventional detached Bucknall Way house.
That property waited around 89 days before reducing by £25,000, before subsequently securing a buyer approximately 42 days later.
There simply isn’t a large enough Bucknall Way sample to claim that price reductions cause homes to take longer.
And I wouldn’t.
The more useful interpretation is this:
A reduction is often evidence that the original campaign didn’t create enough buyer engagement.
By the time the price changes, the property’s most valuable period of novelty may already have passed.
Which brings us back to the launch.
Does one end of Bucknall Way command more?
On headline prices, there appears to be a substantial difference between sections of the road.
For transactions within the analysed period, the BR3 3XL section — containing some of the largest detached houses — produced the highest ten-year median at approximately £1.565 million, compared with around £1.463 million in BR3 3XN.
But here’s the important bit.
Once house size and £ per sq ft are considered, there isn’t compelling evidence that buyers are simply paying a huge premium because of the postcode section itself.
The more obvious explanation is:
The most expensive section contains some of the largest houses.
That’s why property-by-property analysis matters.
A data point I deliberately excluded
Good property analysis also means knowing when not to use a number.
Land Registry records a transaction at 14 Bucknall Way for approximately £625,000 in October 2025.
At first glance, that might dramatically affect road averages.
But the property has an EPC area of only 721 sq ft, wasn’t identified as having been openly marketed, and its implied rate is approximately £867 per sq ft — completely unlike the conventional family houses surrounding it.
So rather than allowing one unusual transaction to distort the picture, I have excluded it from the main recent £/sq-ft analysis.
Because data isn’t useful simply because it exists.
It needs interpreting.
What the evidence appears to be saying
For me, five clues stand out.
Bucknall Way is extremely tightly held.
Large detached houses can command £1.5m–£2m+.
Recent conventional house sales have clustered around approximately £550–£675 per sq ft, with a median near £592.
Properties securing buyers particularly quickly have, in this small sample, tended to achieve extremely close to their original asking prices.
And simply owning a house for five or six years doesn’t determine the outcome — what you own, what you paid, what you’ve done to it and how you bring it back to market all matter.
The underlying report supports all five themes.
Thinking of selling on Bucknall Way?
A generic postcode average can only tell you so much.
If I were analysing an individual Bucknall Way house before launching it, I’d want to understand its:
size, configuration, condition, plot, planning history, exact position, comparable completed sales, current competition and likely buyer psychology.
Only then would I start talking seriously about price.
Because buyers don’t purchase averages.
They compare properties.
And on a road where one in three homes appears to have been held for at least 25 years, getting that rare launch right matters.
If you’re considering selling on Bucknall Way and would like me to investigate your property specifically, get in touch.
James Hall | The Property Perfectionist™
Every road leaves clues.
Clarity. Not optimism. Not guesswork. Just evidence.
Data source: Sprift property intelligence incorporating AddressBase, Land Registry Price Paid, portal marketing and EPC information. Figures relate to the rolling periods stated and should be treated as market intelligence rather than a formal valuation. Sold STC data can change where transactions fall through or properties are subsequently re-marketed. £/sq-ft calculations use available EPC floor-area information and should therefore be regarded as indicative. This article represents an independent professional opinion and is not an RICS Red Book valuation.


Leave a comment