BR3 forensic comparison
Completed sales dated 1 January–30 March 2025 versus 1 January–30 March 2026
The headline is not simply that prices rose or fell.
The clearest change is that recorded sales activity fell sharply across every property type. There are 238 transactions in the 2025 period, compared with 117 in 2026, a reduction of 50.8%.
That means the 2026 price figures are being shaped by far fewer sales and, in some categories, by a different mix of properties.
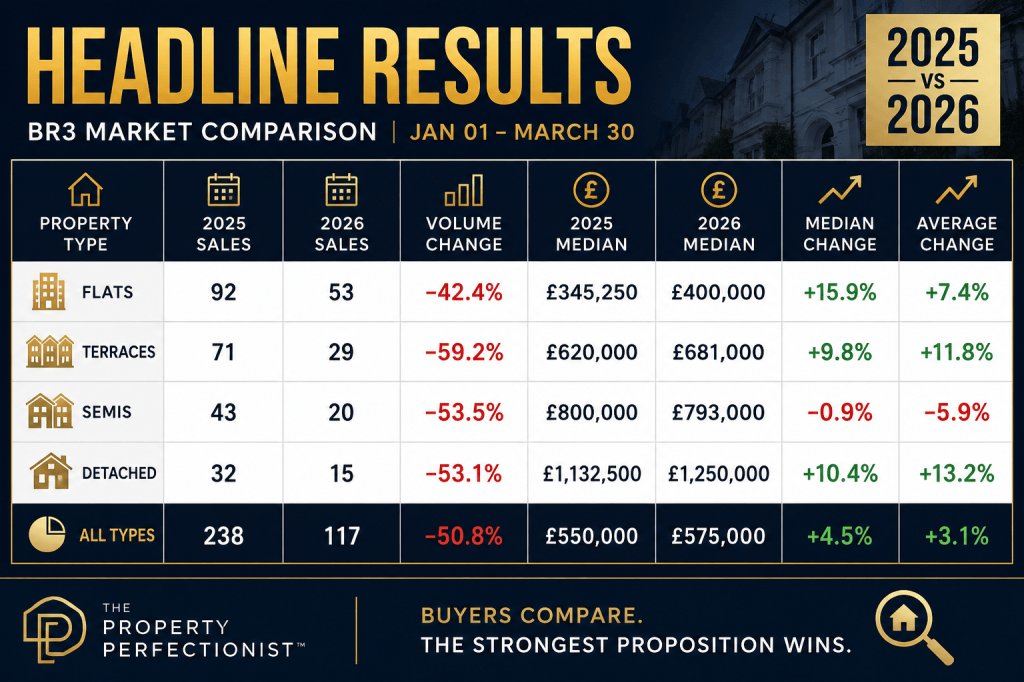
Headline results
| Property type | 2025 sales | 2026 sales | Volume change | 2025 median | 2026 median | Median change | Average change |
|---|---|---|---|---|---|---|---|
| Flats | 92 | 53 | −42.4% | £345,250 | £400,000 | +15.9% | +7.4% |
| Terraces | 71 | 29 | −59.2% | £620,000 | £681,000 | +9.8% | +11.8% |
| Semis | 43 | 20 | −53.5% | £800,000 | £793,000 | −0.9% | −5.9% |
| Detached | 32 | 15 | −53.1% | £1,132,500 | £1,250,000 | +10.4% | +13.2% |
| All types | 238 | 117 | −50.8% | £550,000 | £575,000 | +4.5% | +3.1% |
1. Flats
Flats appear to have performed strongly.
The median rose from £345,250 to £400,000, an increase of 15.9%. However, the average increased by a more moderate 7.4%, from approximately £364,800 to £391,700.
The middle 50% of sales also moved upwards:
- 2025: approximately £282,750–£429,375
- 2026: approximately £325,000–£450,000
This suggests the increase is not being caused solely by one or two expensive flats. The lower end of the recorded market has also shifted upwards.
However, sales numbers fell from 92 to 53. Therefore, the data does not necessarily prove that the same flat is now worth 15.9% more. It may mean that fewer inexpensive flats completed during the 2026 period, leaving a greater proportion of larger, better-located or more desirable flats in the dataset.
Working interpretation: flats look stronger, but some of the apparent growth is likely to be sales-mix driven.
2. Terraced houses
Terraces show the most convincing price strength.
The median increased from £620,000 to £681,000, a rise of 9.8%, while the average rose by 11.8%.
Even after removing the highest and lowest 10% of transactions, the trimmed average increased by approximately 14.9%. This indicates that the increase is not merely the result of one exceptionally expensive terrace.
The middle 50% shifted substantially:
- 2025: approximately £497,500–£717,500
- 2026: approximately £614,000–£775,000
The lower quartile increasing from £497,500 to £614,000 is particularly significant. It suggests that the 2026 terraced sample contained far fewer lower-priced transactions.
But liquidity deteriorated considerably. Recorded sales fell from 71 to 29, down 59.2%.
So there are two simultaneous stories:
- The terraces that sold achieved stronger recorded prices.
- Far fewer terraces sold.
Working interpretation: terraced houses appear resilient on price, but the market is less liquid and may be rewarding only the strongest propositions.
3. Semi-detached houses
Semis are the only category where both the median and average declined.
The median moved from £800,000 to £793,000, a modest fall of 0.9%. The average fell more noticeably, from approximately £833,400 to £783,900, a reduction of 5.9%.
The upper quartile dropped from approximately £952,750 to £870,000, suggesting that fewer high-value semis completed in early 2026.
The trimmed average, which reduces the influence of extreme transactions, also fell by approximately 5.5%.
Recorded sales reduced from 43 to 20, down 53.5%.
This is the most internally consistent evidence of softness in the dataset. Unlike flats, terraces and detached homes, the average, trimmed average and upper quartile all moved in the same downward direction.
Working interpretation: the semi-detached market appears broadly flat at the median but weaker at the upper end.
4. Detached houses
Detached houses produced the most potentially misleading headline.
The median increased from £1,132,500 to £1,250,000, a rise of 10.4%, while the average rose by 13.2% to approximately £1.31 million.
However, only 15 detached sales were recorded in the 2026 period. A small number of premium transactions can therefore move the figures materially.
The distribution supports that explanation:
- Lower quartile: £1.01 million → £845,000
- Upper quartile: £1.35 million → £1.66 million
That is an unusually wide spread. The bottom of the detached sample weakened, while the upper end became considerably more expensive.
This does not resemble a market in which all detached houses rose by 10%. It resembles a market with a more polarised sales mix, some lower-priced detached sales, together with a small number of significantly more expensive homes.
The trimmed average rose by approximately 9.8%, so the increase is not attributable to only the single highest sale. Nevertheless, the sample remains too small to treat the headline increase as general house-price growth.
Working interpretation: detached prices were pulled upwards by the calibre and price distribution of the homes that completed. It does not prove that the typical detached house gained 10.4%.
What the evidence appears to be saying
Liquidity has deteriorated
Every category recorded substantially fewer transactions:
- Flats: −42.4%
- Terraces: −59.2%
- Semis: −53.5%
- Detached: −53.1%
Some of the 2026 shortfall may reflect Land Registry registration delays, so the volume comparison should not be treated as a final measure of completed market activity. Nevertheless, the difference is large enough to warrant caution.
Price resilience is concentrated
The data does not show a uniformly rising BR3 market.
It shows:
- stronger recorded prices for flats;
- strong prices but extremely low turnover for terraces;
- softness among semis;
- a polarised and small detached sample.
Median growth does not automatically equal property growth
The median measures the middle transaction within each period. It does not compare identical properties.
A higher median can arise because:
- larger homes sold;
- better roads were represented;
- fewer compromised homes completed;
- fewer low-value transactions appeared;
- the balance between Beckenham’s micro-markets changed.
This is particularly important for flats and detached homes.
My forensic conclusion
The strongest claim supported by the data is not:
“BR3 property prices increased significantly in early 2026.”
It is:
“Far fewer sales were recorded, while the properties that did complete were concentrated differently across the market.”
Terraces appear to show the strongest price resilience. Semis provide the clearest evidence of genuine price softness. Flats look stronger, although the size and quality of the completed stock may explain part of the rise. Detached results are too thin and too polarised to support a broad conclusion.
For sellers, the reduced transaction count matters more than the headline median.
It suggests a market in which buyers are more selective and fewer properties are successfully reaching completion. In that environment, being broadly comparable is not enough.
Buyers compare. The strongest proposition wins.


Leave a comment