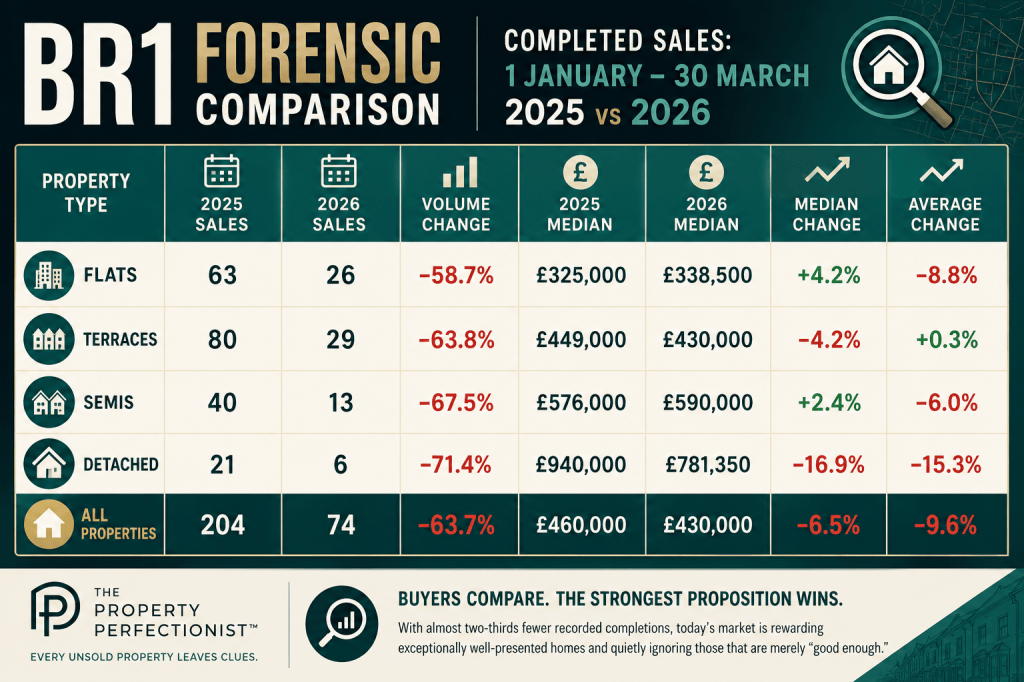
This dataset tells a very different story from BR3.
Rather than seeing higher prices supported by fewer sales, BR1 shows falling liquidity combined with an overall weakening in values, particularly at the upper end.
BR1 Forensic Comparison
Completed sales: 1 January–30 March 2025 vs 1 January–30 March 2026
| Property type | 2025 sales | 2026 sales | Volume change | 2025 median | 2026 median | Median change | Average change |
|---|---|---|---|---|---|---|---|
| Flats | 63 | 26 | -58.7% | £325,000 | £338,500 | +4.2% | -8.8% |
| Terraces | 80 | 29 | -63.8% | £449,000 | £430,000 | -4.2% | +0.3% |
| Semis | 40 | 13 | -67.5% | £576,000 | £590,000 | +2.4% | -6.0% |
| Detached | 21 | 6 | -71.4% | £940,000 | £781,350 | -16.9% | -15.3% |
| All properties | 204 | 74 | -63.7% | £460,000 | £430,000 | -6.5% | -9.6% |
The first clue
The biggest story isn’t price.
It’s liquidity.
Every property type recorded dramatically fewer completed sales.
Overall:
- 204 completions → 74
- 63.7% fewer recorded transactions
That is an extraordinary reduction.
Whether partly explained by Land Registry registration lag or not, it tells us one thing:
Far fewer homes are successfully completing.
Flats
At first glance, flats appear slightly stronger.
Median price increased by 4.2%.
But then another clue appears.
The average price actually fell by almost 9%.
Normally, median and average move together.
When they diverge like this, it usually means the market mix has changed.
Higher-value flats appear to have been less active, while mid-market flats continued to transact.
I wouldn’t conclude flats have risen by 4%.
I’d conclude they’re broadly stable.
Terraces
Terraces tell a fascinating story.
Median:
£449,000 → £430,000 (-4.2%)
Average:
Almost unchanged.
That usually indicates the market itself hasn’t dramatically weakened…
…but buyers are becoming much more selective.
Good terraces continue to sell.
Average terraces appear to be struggling.
Semi-detached houses
Semis are remarkably resilient.
Median increased slightly.
Average declined around 6%.
Again…
That suggests better semis are still finding buyers…
while weaker propositions aren’t.
Detached houses
This is where the evidence becomes much stronger.
Sales collapsed:
21 → 6
Median price fell almost 17%.
Average price fell 15%.
Only six detached sales completed.
That means every sale has a huge influence.
However…
Even allowing for the tiny sample…
It’s difficult to ignore how much weaker detached performance appears.
This mirrors what many agents have been seeing on the ground.
Fewer buyers.
Longer decisions.
Greater negotiation.
Much greater price sensitivity.
Overall market
The headline numbers are revealing.
Median price:
-6.5%
Average price:
-9.6%
Sales volume:
-63.7%
Unlike BR3…
There isn’t evidence here of prices being supported by premium stock.
Instead…
There is evidence of a quieter market with fewer successful transactions and softer pricing.
My forensic conclusion
BR1 appears considerably softer than BR3.
The detached market is showing the clearest signs of weakness.
Terraces and semis remain relatively resilient, but only the strongest homes appear to be attracting buyers.
Flats look broadly stable, although the conflicting median and average suggest changing sales mix rather than genuine growth.
The overriding message isn’t simply that prices have fallen.
It’s that buyers have become extraordinarily selective.
With almost two-thirds fewer recorded completions, today’s market is rewarding homes that are positioned exceptionally well and quietly ignoring those that are merely “good enough.”
Buyers compare.
The strongest proposition wins.


Leave a comment